Making Selling A Home Cheaper

On Friday, Yahoo Finance posted an article about a change in the commission rate that many realtors will make when selling a home.

The article reports:

The 6% commission, a standard in home purchase transactions, is no more.

In a sweeping move expected to dramatically reduce the cost of buying and selling a home, the National Association of Realtors announced Friday a settlement with groups of homesellers, agreeing to end landmark antitrust lawsuits by paying $418 million in damages and eliminating rules on commissions.

The NAR, which represents more than 1 million Realtors, also agreed to put in place a set of new rules. One prohibits agents’ compensation from being included on listings placed on local centralized listing portals known as multiple listing services, which critics say led brokers to push more expensive properties on customers. Another ends requirements that brokers subscribe to multiple listing services — many of which are owned by NAR subsidiaries — where homes are given a wide viewing in a local market. Another new rule will require buyers’ brokers to enter into written agreements with their buyers.

…By some estimates, real estate commissions are expected to fall 25% to 50%, according to TD Cowen Insights. This will open up opportunities for alternative models of selling real estate that already exist but don’t have much market share, including flat-fee and discount brokerages.

I have very mixed emotions on this. I support the change because I think it was needed in view of the inflation of house prices in recent years. A 6 percent commission on selling a house for $100,000 would be $6,000. Obviously some of that commission would be paid to the Real Estate Agency–the agent would not be able to keep the entire amount. According to Statista, the average price of a house sold in 2023 was &511,100. The real estate agent’s commission on the sale of that house would be approximately $30,000. I realize that the agent has expenses-a photographer to photograph the house, the cost of multiple listing, etc., but that seems high. I hope with this lawsuit, we will get back to more of a free market in real estate sales where the rate is competitive. I don’t want to see either a private or government monopoly determining real estate commissions.

The Impact Of Inflation

On Thursday, The Center Square posted an article about the impact of inflation on homebuyers.

The article reports:

(The Center Square) – The housing market is not immune from inflationary woes as buyer’s purchasing power has significantly diminished in four years. Home buyers in 2024 need 80% more income to purchase a home than they did in 2020, according to a new report by Zillow.

“The income needed to comfortably afford a home is up 80% since 2020, while median income has risen 23% in that time,” the report states. That equates to $47,000 more than four years ago.

“Home shoppers today need to make more than $106,000 to comfortably afford a home,” according to the report. “That is 80% more than in January 2020.”

A monthly mortgage payment for a typical U.S. home has nearly doubled since January 2020, the report notes, up 96.4% to $2,188. The calculations are based on a 10% down payment.

Home values also increased over 42% in the last four years, with the typical home nationwide worth roughly $343,000, according to Zillow’s January market report. Mortgage rates in January 2020 were 3%, the report notes. By February 2024, they are closer to 7%.

The article notes:

The report’s analysis was based on quarterly median household income from the American Community Survey, Moody’s Analytics, and the Bureau of Labor Statistics’ Employment Cost Index.

The findings were announced as total household debt reached a record $17.5 trillion in the fourth quarter of 2023, according to a Federal Reserve Bank of New York report. Mortgage debt increased by $112 billion in Q4 2023 to reach $12.25 trillion. Balances on home equity lines of credit increased by $11 billion, the seventh consecutive quarterly increase after Q1 2022. There are currently $360 billion in aggregate outstanding balances, the Fed states.

The overspending of our government impacts all of us. There will eventually be a tipping point where the housing market crashes because people cannot afford to buy houses. We need to un-elect any Congressman or Senator that continues to vote for overspending.

The Real Cost Of Living

Washington always finds a way to lie with statistics when it comes to the economy. Limiting the items included in the Consumer Price Index (CPI) is one way to convince Americans that inflation isn’t as bad as it seems and also a way to limit the Cost of Living Adjustment (COLA) of various federal disbursements. However, those fake numbers don’t help Americans deal with the rising cost of food and gasoline.

On Sunday, PJ Media posted an article about the rising cost of living in America.

The article reports:

Perhaps the most misleading government statistic of all is the Consumer Price Index. The CPI is an incredibly important statistic because so many government programs that benefit American citizens are tied to that number.

It’s usually cited as the inflation rate, but it’s not really. The CPI is the rate of increase in a subjective “market basket” of goods and services. The things that concern you and me the most as far as price increases have very little to do with the CPI. The CPI doesn’t track food or gas prices at the pump, so the CPI that we see every month doesn’t tell us anything useful.

Right now, the CPI stands at 3.1%. That’s down from a high of 9.1% in June 2022. But even that doesn’t tell us the whole inflation story because along with skyrocketing food and gas prices, real wages failed to keep pace with the price increases.

According to The New York Sun:

The Bureau of Labor Statistics released jobs numbers this morning that show non-farm wages increased 4.1 percent in the past year, which is above the inflation rate of 3.1 percent. The problem is that inflation-adjusted real hourly wages — those of the average blue-collar or middle-class person — are down 4.7 percent today from when Mr. Biden took office. That’s a weekly earnings decline in real wages to $381 in November 2023 from $399 in January 2021, according to the Bureau of Labor Statistics.

“The reason Biden polls so badly is that there’s a decline in wages and an increase in prices,” a former economic adviser to President Trump, Larry Kudlow, tells the Sun. He calls this the “affordability crisis.”

Americans feel it when they walk into the grocery store. Food prices increased nearly 6 percent in 2023, according to the Department of Agriculture. In 2022, at-home food prices — what one buys in a grocery store — increased more than 11 percent. No matter one’s income, it’s hard not to notice the rising cost of food at the grocery store and at restaurants — even fast food.

Are voters going to believe what they are told or what they see?

The Real Numbers On The Coronavirus Deaths

On November 22nd, The Johns Hopkins Newsletter posted an article with a statistical analysis of coronavirus deaths in America. Please follow the link to read the entire article–there are a lot of numbers and charts.

The first premise in the article is logical, but unnoticed by the American media:

According to new data, the U.S. currently ranks first in total COVID-19 cases, new cases per day and deaths. Genevieve Briand, assistant program director of the Applied Economics master’s degree program at Hopkins, critically analyzed the effect of COVID-19 on U.S. deaths using data from the Centers for Disease Control and Prevention (CDC) in her webinar titled “COVID-19 Deaths: A Look at U.S. Data.”

From mid-March to mid-September, U.S. total deaths have reached 1.7 million, of which 200,000, or 12% of total deaths, are COVID-19-related. Instead of looking directly at COVID-19 deaths, Briand focused on total deaths per age group and per cause of death in the U.S. and used this information to shed light on the effects of COVID-19.

She explained that the significance of COVID-19 on U.S. deaths can be fully understood only through comparison to the number of total deaths in the United States. 

After retrieving data on the CDC website, Briand compiled a graph representing percentages of total deaths per age category from early February to early September, which includes the period from before COVID-19 was detected in the U.S. to after infection rates soared. 

Surprisingly, the deaths of older people stayed the same before and after COVID-19. Since COVID-19 mainly affects the elderly, experts expected an increase in the percentage of deaths in older age groups. However, this increase is not seen from the CDC data. In fact, the percentages of deaths among all age groups remain relatively the same. 

“The reason we have a higher number of reported COVID-19 deaths among older individuals than younger individuals is simply because every day in the U.S. older individuals die in higher numbers than younger individuals,” Briand said.

Another interesting fact:

Analysis of deaths per cause in 2018 revealed that the pattern of seasonal increase in the total number of deaths is a result of the rise in deaths by all causes, with the top three being heart disease, respiratory diseases, influenza and pneumonia.

“This is true every year. Every year in the U.S. when we observe the seasonal ups and downs, we have an increase of deaths due to all causes,” Briand pointed out.

When Briand looked at the 2020 data during that seasonal period, COVID-19-related deaths exceeded deaths from heart diseases. This was highly unusual since heart disease has always prevailed as the leading cause of deaths. However, when taking a closer look at the death numbers, she noted something strange. As Briand compared the number of deaths per cause during that period in 2020 to 2018, she noticed that instead of the expected drastic increase across all causes, there was a significant decrease in deaths due to heart disease. Even more surprising, as seen in the graph below, this sudden decline in deaths is observed for all other causes.

The conclusion is something many of us have suspected for a long time:

This trend is completely contrary to the pattern observed in all previous years. Interestingly, as depicted in the table below, the total decrease in deaths by other causes almost exactly equals the increase in deaths by COVID-19. This suggests, according to Briand, that the COVID-19 death toll is misleading. Briand believes that deaths due to heart diseases, respiratory diseases, influenza and pneumonia may instead be recategorized as being due to COVID-19.

Please read the entire article. It illustrates how the media has manipulated data to cause fear and uncertainty in America and around the world.

UPDATE: THE ARTICLE IN THE JOHNS HOPKINS NEWSLETTER HAS BEEN TAKEN DOWN BECAUSE IT DID NOT FIT THE MEDIA NARRATIVE. THE EXCERPTS FROM THE ARTICLE POSTED HERE ARE STILL VALID–JUST NOT POLITICALLY CORRECT.

Numbers Don’t Lie (But Politicians Do)

John Hinderaker posted an article at Power Line Blog yesterday about one aspect of the latest draft of the Democrat Party platform. The article notes that the platform is largely an attack on white people. The platform mentions whites or whiteness 15 times, never in a positive light.

The article includes a quote from the platform:

Median incomes are lower and poverty rates are higher for Black Americans, Latinos, Native Americans, and some Asian Americans and Pacific Islanders, compared to median white households.

Well, the article includes a chart from the 2018 Census:

As you can see, the charge included in the draft of the Democrat Party platform is not true.

The article concludes:

The Democrats are right to focus on median income as a basic indicator of well-being, but they have to lie about the statistics. They can’t face the reality that America is a land of opportunity, and there is nothing standing in the way of people of any ethnicity succeeding in the most fundamental way: making money.

If the United States were really a white supremacist society, as the Democrats claim, the facts would be very different. Whites incomes would dwarf non-white incomes. That obviously is not the case, which demonstrates that America is not a racist or white supremacist society. The Democrats are wrong. It is hard to see why voters would entrust with power a party that falsely slanders its own country.

The platform is being put together with a purpose. After seeing the racism and the lies in the platform, I wonder what that purpose is.

A Very Costly Decision

The decision to send coronavirus patients into nursing homes was a very expensive decision. In early June The New York Post reported that nearly one fourth of the deaths from the coronavirus occurred in nursing homes. More recent statistics show a higher percentage. A number of states required nursing homes to accept patients with the disease after they were discharged from the hospital. In New York, this is particularly aggravating because beds were available at the Javits Center and the hospital ship that was docked in the harbor. Both had been refitted to allow them to take patients with the virus. There was also the hospital set up by Samaritan’s Purse in Central Park. There were other options than nursing homes. The decision to send the coronavirus patients back to nursing homes in New York was made by Governor Cuomo.

Yesterday The New York Post posted an article about Governor Cuomo’s decision.

The article reports on Governor Cuomo’s latest efforts to avoid responsibility for that decision:

His latest bid is simply scandalous. Cuomo has the nerve to blame grieving family members and heroic nursing-home staffers, charging they were the ones who infected and killed as many 12,000 elderly and helpless residents.

Desperation is no excuse. This is shamelessness on stilts. And it is heartlessly cruel to blame the victims.

The outrageous claims came in a report released by state Health Commissioner Dr. Howard Zucker, along with hospital administrators. Conveniently, the report they prepared absolves all of them of any responsibility. What a coincidence!

Coverups don’t get any more brazen. Or less credible.

The fact remains that Zucker wrote, with obvious hospital ­input, the March 25 order forcing all nursing homes to take people infected with the coronavirus. It ultimately resulted in 6,326 sick patients being transferred from hospitals to nursing homes between March 25 and May 8.

The homes and other long-term-care facilities were given no warning, advice or help in preparing to receive those patients. There were no inspections to learn whether the facilities had space and staff to segregate COVID patients from the long-term residents, most of whom were especially vulnerable to the virus.

The order was so flawed that it even blocked the facilities from asking if those being transferred had tested positive for the virus. All those demands run counter to federal recommendations and requirements.

The article continues:

While there may have been isolated cases of infected, asymptomatic visitors, the fact remains that the nearly 600 facilities involved did not have significant numbers of coronavirus cases and deaths until the days and weeks following the March 25 order. Some had zero cases until then.

The insistence that the order played no role won’t wash. For one thing, Cuomo’s office claims the Zucker report was “peer reviewed,” but only by organizations that have a stake in its conclusions.

For another, in addition to The Post, which first recognized the lethality of the order, numerous other media outlets have independently confirmed the consequences. In this case, that’s peer review worth the name.

Indeed, it became so obvious that the March 25 order was a fatal blunder that Cuomo effectively rescinded it on May 10. Then, with a quick pivot and a grinding of gears, he shifted into an ­unconscionable hunt for scapegoats.

And hasn’t stopped. Some days, there is more than one. Trump is a frequent target, with Cuomo saying recently that the president “makes up facts, he makes up science.”

He also accused the president of being in “denial of the problem” and added, “He is facilitating the virus, he is enabling the virus.”

If that sounds familiar, it’s because many people say exactly the same things about Cuomo.

It is understood that Governor Cuomo wants to run for President. I don’t know how he could pull that off in 2020, but we can expect to see him on the Democrat ticket in 2024. He needs to put the nursing home death scandal behind him before he runs. I am not sure that a biased report by the State Health Commissioner can accomplish that.

Leadership Matters

The Washington Post accused President Trump of lying when he stated that “the most dangerous cities are run by democrats.”  The Conservative Treehouse posted a graph yesterday the shows that the President’s statement was pretty accurate.

Here is the graph:

The article notes:

A republican mayor was elected to Jacksonville in the last election; therefore the Washington Post has declared that President Trump’s claim: “the most dangerous cities are run by democrats”, is false. There is a top-crime city now run by a republican.

This level of FAIL is so ridiculous, it presents itself almost as if the Washington Post intentionally trying to beclown themselves.

In 1994 Rudy Giuliani became Mayor of New York City. Mayor Giuliani instituted what was referred to as ‘The Broken Windows Theory.”

Worldatlas.com describes The Broken Windows Theory as follows:

The origin of Broken Windows Theory can be traced back to a psychologist from Stanford, Connecticut, named Philip Zimbardo. He had set up a social experiment to test the theory in 1969. Zimbardo parked an old car in the Bronx, and another one of similar condition parked in Palo Alto, Califiornia. The car in the Bronx was vandalized almost immediately with all items of importance stolen. The other car in Palo Alto was left undisturbed for more than a week before Zimbardo himself went and smashed its windows. Within hours, other people came and vandalized the car as well. The hypothesis is that a community such as the Bronx, where city services may not have the resources to encourage the upkeep of its facilities, would be more apathetic than an upscale area like Palo Alto. This theory was later stated in an article in 1982 by James Wilson and George Kelling who stated that criminal activities in a community begin as small misdemeanors and gradually grow to become capital offenses. The authors also stated that the best way of dealing with crime was dealing with it in its infancy through making neighborhoods free of social ills such as prostitution, drug abuse, and other disorderly tendencies.

In the 1980s and 70s, New York City had seen an upsurge in criminal activity and the city’s municipal council was desperately seeking solutions to the menace that was tarnishing its reputation. The city’s Transit Authority then hired the author of the “Broken Windows” article, Mr. George Kelling as a consultant who then suggested the implementation of the theory. The Transit Authority’s leader, David Gunn implemented the approach by first clearing all graffiti from the city’s subway system which was conducted during his final term from 1984 to 1990. Kelling’s successor, William J. Bratton continued with the implementation of the theory through non-tolerance of fare-dodging as well as reducing leniency during arrests for petty offences. In 1993, New York City Mayor Rudy Giuliani hired Bratton as the police commissioner, and this gave Bratton a wider scope to implement the broken windows theory and was noted for arrests over public urination, public drinking, and other misdemeanors. Several studies in the past have linked the significant decline in criminal activities in the past decade to Bratton’s implementation of the “broken windows” theory. The impressive results of New York City’s implementation of the theory have made several other US cities implement the theory including Boston, Albuquerque, and Lowell.

Law and order makes a difference. When people understand that there are consequences for breaking the law, they tend to respect the law. When Mayors do not enforce the law, things will eventually become unruly. For whatever reason, Republicans seem to be more inclined to support the police and enforce the law than Democrats. The statistics posted by The Washington Post bear that out.

Social Distancing Isn’t All It’s Cracked Up To Be

The Gateway Pundit posted an article today detailing how the country of Sweden has handled the coronavirus outbreak. Sweden tried a totally different path than most of the world, and the results are astonishing.

The article reports:

Reporter Johan Norberg joined Laura Ingraham on Thursday to discuss the Sweden’s ‘controversial’ policies during the COVID-19 pandemic.

Unlike other Western countries progressive Sweden, of all places, decided to leave their economy running and let the disease run its course while the population reached herd immunity.

The Swedish plan appears to be working.
Sweden, a country of 10 million, now has 2,152 reported coronavirus related deaths.
New York, a state of 19.85 million, now has 20,861 reported coronavirus related deaths.

Sweden is actually seeing better results than several of its European neighbors.

On Thursday Sweden’s chief epidemiologist announced the Swedish strategy appears to be working and that “herd immunity” could be reached in the capital Stockholm in a matter of weeks.

The article concludes with a portion of the transcript of the conversation:

Laura Ingraham: We found out that herd immunity will be reached in about 2-3 weeks in Sweden. I mean, then they’re kind of done.

Johan Norberg: That’s why we shouldn’t make too many comparisons to cases and deaths right now. Because almost every other country except Sweden has just postponed deaths. They won’t avoid them because there is still no argument that has been made that suddenly this disease will go away after their lockdowns are over. I mean if they’re waiting for a vaccine that could take over a year if we’re lucky. It could take several years. And no society can be shut down completely and shut down the economy for more than a year without ruining society and the economy entirely. And that will kill many more people than the virus does.

Herd immunity is the best solution to this virus. It seems that because of our lockdown, we may have delayed reaching that point. However, because we are being told that the virus does not like heat or humidity, the virus may exit the southern United States before the south faces the long term health consequences of the lockdown.

Shady Statistics

Fox News is reporting that the federal government is classifying the deaths of patients infected with the coronavirus as COVID-19 deaths, regardless of any underlying health issues that could have contributed to the loss of someone’s life.

The article reports:

Dr. Deborah Birx, the response coordinator for the White House coronavirus task force, said the federal government is continuing to count the suspected COVID-19 deaths, despite other nations doing the opposite.

“There are other countries that if you had a pre-existing condition, and let’s say the virus caused you to go to the ICU [intensive care unit] and then have a heart or kidney problem,” she said during a Tuesday news briefing at the White House. “Some countries are recording that as a heart issue or a kidney issue and not a COVID-19 death.

“The intent is … if someone dies with COVID-19 we are counting that,” she added.

Asked whether the numbers could skew data the government is trying to collect, Birx said that would mostly apply more to rural areas where testing isn’t being implemented on a wide scale.

“I’m pretty confident that in New York City and New Jersey and places that have these large outbreaks and COVID-only hospitals. … I can tell you they are testing,” she said.

Dr. Michael Baden, a Fox News contributor, said it’s reasonable to include the death of someone infected with the virus, who also had other health issues, in the COVID-19 body count.

Follow the link to read the entire article. This seriously causes me to wonder about the validity of any of the numbers we are seeing regarding deaths due to the coronavirus. People die of heart attacks, cancer, and strokes every day. If they have the coronavirus, those deaths are reported to be the result of the virus. It would be interesting when this is over to compare the number of deaths from heart attacks, cancer, and stokes from this time period to another time period. If the number is significantly lower during this time, it would be easy to conclude that the coronavirus deaths were being exaggerated.

You Might Not Have Read This In The Mainstream Media

Yesterday The Western Journal posted some comments by Dr. Marc Siegel, a professor of medicine at New York University, a medical correspondent for Fox News, and the author of “False Alarm: The Truth About the Epidemic of Fear.”

The article reports Dr. Siegel’s comments:

“I’ve been handling these emerging contagions for about 20 years now, and I have to tell you, I’ve never seen one handled better,” Dr. Marc Siegel said regarding the actions of President Donald Trump since the coronavirus first emerged as a concern in January.

…“The task force are really top players,” said Siegel, noting the inclusion of Dr. Anthony Fauci, director of the National Institute of Allergy and Infectious Diseases. Fauci is “one of the top infectious disease experts in the country,” he noted.

“They’ve been doing exactly what they’re supposed to be doing,” he said, listing actions Trump has called for such as “restricting travel, isolating patients who are sick and, trying to cut down on contact. It’s a very hard thing to do when people are pouring in from all over the world.”

CDC Director Dr. Robert Redfield, a virologist, and Dr. Nancy Messonnier, an expert in vaccines who has been sounding the alarm about the virus, are also important members, he said, though he believes the “doom and gloom comment” about the inevitable spread of the virus was uncalled for.

Siegel said that the coronavirus is different from diseases such as SARS or the flu.

“SARS had about a ten percent mortality [rate], but it only affected about 8,000 people. Swine flu had a very, very low mortality for flu, but flu itself really only causes about a point-four percent death rate, and [coronavirus] is about one-point-four percent. So this is killing more than flu, but I want to make a couple of points that will reassure people,” he said.

“One, at the beginning of an emerging contagion, it always appears more deadly than it actually is. The 1918 flu is an exception, but normally as time goes on, it’s less deadly, and part of that is because you see more immunity appearing, and you also find a lot of milder cases — or even cases where people don’t get sick at all. You find that as you start to test more people,” he said.

He also noted that people who were infected but never got sick do not show up in statistics, making the virus seem more deadly than it is.

The bottom line here is that the coronavirus is serious, but it is not the 1918 flu. Wash your hands, and use common sense. Winter is ending, and hopefully the flu season will end with it!

This Isn’t A Surprise To Any Unbiased Person

On Monday The Washington Examiner posted an article about race relations in America. We still have those who are trying to profit or gain personally by creating racial discord, but generally speaking America is doing better.

The article reports:

Satisfaction with race relations in the United States has jumped under President Trump, the latest indication that the Republican is making significant inroads with blacks and other minorities in advance of the 2020 presidential election.

New details from a Gallup survey on satisfaction said race relations and the “position” of minorities under Trump are far higher than they were under President Barack Obama, the nation’s first black president.

Race relations scored the highest satisfaction advance, 14 points, from 22% at the end of the Obama administration to 36% this month, said Gallup.

The article includes the following chart:

These statistics may explain why the Democrats were willing to embark on the seemingly suicidal mission of impeachment.

The article concludes:

What’s more, Gallup said that the nation’s average satisfaction rate is at a 15-year high.

Said the survey analysis:

“Americans’ average satisfaction rating for the 27 issues Gallup has tracked consistently since 2001 is now 47%. This is up three points from a year ago and is the highest since the January 2005 poll.

“Today’s average satisfaction is roughly on par with the level of the early 2000s. Only in 2002 was the average for this metric substantially higher than it is today. The average 53% recorded that year reflected heightened satisfaction as Americans were in full ‘rally around the flag’ mode shortly after the 9/11 attacks.”

President Trump has been a very successful President. It is a shame that most of the mainstream media has chosen to ignore that fact.

The Impact Of Common Core On Education

By 2014, 45 states and the District of Columbia were using the Common Core standards as the basis for the public education of their children. So what has been the impact of Common Core?

U.S. News & World Report posted an article today with the headline, “Across the Board, Scores Drop in Math and Reading for U.S. Students.” So what is going on in our schools?

On October 26th, the website Lady Liberty 1885 posted an article that might give us a clue as to what has gone wrong.

The article included a form to allow teachers to make a “social, emotional and behavioral assessment” of each student.

This is the form:

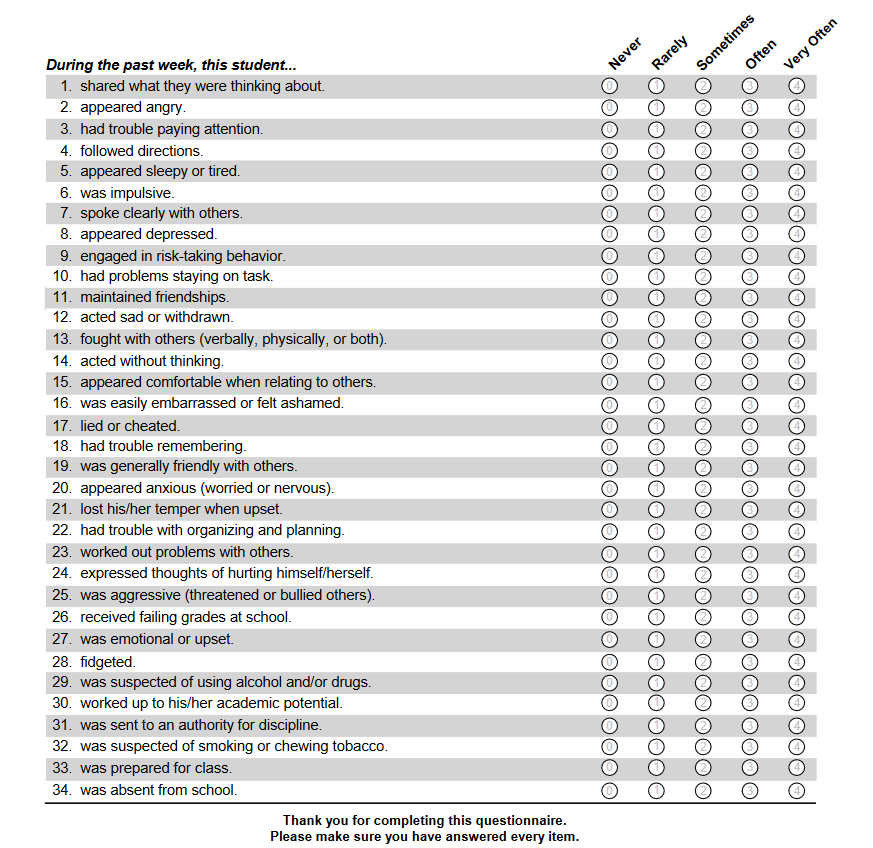
No wonder to test scores are sinking–the teachers are too busy evaluating the emotional condition of students and filling out forms. Look at some of the items on this form–they are very subjective. If something about a student makes a teacher uneasy or vice versa, will the form be filled out objectively? Who gets to see this form? Does the form follow the student all the way through school? If a student has a bad year, does it follow him into the next year?

The article at Lady Liberty 1885 sums up the situation as follows:

Let’s Recap

So, for those keeping score:

    • A letter about the assessment dated Oct. 18 to parents went out to some students but not all at our schools. The letter did not name the assessment.
    • I got a copy of the letter from another parent at our school on Oct. 23 but had not received one for our child yet.
    • On Oct. 24, the day after I received the copy of the letter and started asking questions, a copy of the Oct. 18 letter magically was given out to my son’s class.
    • Only when I received the opt-out form did I learn the name of the assessment, which is the BIMAS-2.
    • So far, I am being denied my rights as a parent to inspect this tool.
    • No one at my child’s school can show me the tool because no one has access to this behavioral screening tool, not even the principal. This begs the question: how is this second period teacher even rating the kids?
    • According to the principal at my son’s school, only the district communications director, Tim Simmons, can discuss this tool with parents. I have emailed Mr. Simmons directly and have not received a reply yet.

None of what I just enumerated is remotely OK.

WCPSS’ tactic of using district-wide dragnet to pull all students into this experiment is not OK either.

If the district wants to make this tool available to families who may have an at-risk student, great, go ahead and do that, but make it OPT-IN.

This district, and in particular the WCPSS School Board, has a proven track record of running right over the top of parents and it has to stop. Parents have been an afterthought if we are even considered at all. We should be the first thought.

Children belong to their parents and what starts with parents changes everything.

The article at U.S. News & World Report notes:

Most concerning, she (Peggy Carr, associate commissioner of the National Center for Education Statistics) said, was that compared to 2017, the scores of lower performing students declined in three of the four grade-subject combinations and those drops are what accounted for the overall drop in average scores.

“The distributions are pulling apart, with the bottom dropping faster,” Carr said. “It’s not clear what’s happening here, but it is clear and it’s consistent.”

“The fact that students who need to make the most academic progress are instead making no progress or are falling further behind is extremely troubling,” Tonya Matthews, vice chairwoman of the National Assessment Governing Board, which oversees NAEP, said in a statement. “We need to see all students make progress.”

Carr said the score drops cannot be traced to any one specific student subgroup, as almost all of them logged declines. For example, black, Hispanic, Native American and white students in fourth and eighth grades scored lower in reading in 2019 compared to 2017.

“They are generally all declining,” she said. “So we can’t say it’s due to changes and shifts in the populations.”

Carr said that she’d love to be able to more fully analyze all the subgroup data they collect, but her team is strapped for resources. She encouraged other researchers to dig deeper.

How about we go back to the teaching methods that worked in the past? We can get our  curriculum from Minnesota and Massachusetts who have traditionally ranked high in both mathematics and language. Common Core has been a failed experiment that has cheated our children out of the education they need. It has also been a way to force social programs on our children that are an invasion into the privacy of parents and have a detrimental impact on the family unit. It is time to go back to basics. It wasn’t broken–you shouldn’t have tried to fix it!

The Impact Of The Policies Of President Trump

Yesterday Breitbart reported that Latino business owners are enjoying a 46 percent jump in revenue this year.

The article reports:

In May, Alfredo Ortiz of the Job Creators Network said that although Democrats claimed the Trump economy was no help to the Hispanic community, the facts revealed the opposite.

Ortiz wrote:

The fact is that Hispanics are flourishing in the Trump economy. Democrats asserting the contrary is a mere partisan talking point to try to deny Trump the Hispanic support he has earned and which may decide the presidential election outcome next year. Expect Democrats to increase their identity politics attacks in an effort to skew Latinos against Republicans over the next year and a half.

In September of 2018, Arora called the rapidly expanding Latino community a “powerful force” and stated that their businesses “contribute more than $700 billion to the economy annually.”

“The achievements of Latino small businesses are impressive when you consider it is often hard for them to gain access to capital. Yet they are making progress,” Arora concluded.

The Democrats will say anything to convince people that the Trump economy is not working for average Americans and minorities, but thinking Americans can look at the statistics and realize that the numbers show that average Americans and minorities are the people who have benefited from President Trump’s economic policies. If these groups want their prosperity to continue, they need to vote to continue those policies. I can guarantee that no Democrat running for President will continue those policies.

The Cost Of Congressional Inaction

America has needed a reasonable approach to immigration for years. Congress has chosen not to meet this need. So what is the cost of their inaction? Today’s Washington Examiner has some of the numbers.

The Washington Examiner reports:

Federal arrests of noncitizens have jumped over 200% in the last 20 years and now account for 64% of those arrested, according to the Justice Department.

The Bureau of Justice Statistics said that federal arrests of non-Americans rose 234% from 1998-2018. For U.S. citizens, the percentage rose just 10% over those 20 years.

The newly released statistics feed the Trump administration’s narrative that an increase in immigration, especially illegal immigration, has fed a spike in crime.

The article concludes:

Also over that period, illegal immigration has surged off and on and the bureau said that immigration crimes account for the bulk of arrests. In the past, Department of Homeland Security authorities have accounted for a majority of the arrests.

“20 years, 95% of the increase in federal arrests was due to immigration crimes. From 1998 to 2018, federal immigration arrests increased 5-fold (from 20,942 to 108,667), rising more than 50,000 in one year from 2017 to 2018,” said the Justice Department.

Vaughan, the director of policy studies for the Center for Immigration Studies, said that the statistics and types of crimes disprove claims by pro-immigration advocates that illegal immigrants aren’t involved in crimes.

“Opponents of immigration enforcement are obsessed with trying to establish that illegal aliens and legal immigrants commit fewer crimes than Americans, and so, as their narrative goes, local law enforcement agencies should not cooperate with ICE and should adopt sanctuary policies. This is first of all not true, but is off-point and a dangerous conclusion. What these numbers show is that there are certain types of crime that are disproportionately associated with illegal aliens: drug trafficking, certain gang crimes, and identity theft and document fraud,” she told Secrets.

I can’t even imagine how much this is costing our federal government. It would seem that with budget deficits as far as the eye can see, Congress might be willing to look at fixing the immigration problem as one positive step toward reducing government spending, Nope–the political issue is worth more than the solution. Also, is Congress willing to take responsibility for the Americans who have been harmed by illegal immigration?

A Few Observations From The Polls

I have visited my local voting place twice today. Don’t worry–I didn’t vote twice–my husband was handing out information, and I went to provide food and moral support. While I was there, I picked up some literature from the Democrats and investigated the talking points on their local website.

This is what I learned.

Their website states:

Democrats are standing up for the American Dream: an economy and government that works for everyone, not just the few.

Found on their Twitter page:

Hi kids, this is your Mom. Remember to vote on 11/6. If Trump cuts my Social Security and Medicare I’m moving in with you!

Both these statements are totally misleading.

The American Dream is more accessible to everyone under President Trump than it was under President Obama, a Democrat. According to a Western Journal article posted December 18, 2017:

The national unemployment rate for black Americans, ages 16 and over, is the lowest it has been in 17 years, according to the Bureau of Labor Statistics.

In November 2016, the unemployment rate for black people was at 8 percent, and in November 2017 that rate dropped to 7.3 percent — a percentage not seen since the months of September, October and November 2000.

As reported by CNS News, black unemployment rate during the Bush and Obama era’s fluctuated between 7 and 17 percent.

BLS data also shows that labor force participation among African-Americans rose from 61.9 percent in November 2016 to 62.2 percent in November 2017.

Unemployment rate for the Hispanic demographic fell from 5.7 percent to 4.7 percent — the lowest it’s been in 44 years, while the unemployment rate for whites and Asians hovered around 3 percent, roughly the same as one year prior.

About Social Security cuts–none of us can predict the future, but we can draw conclusions based on past behavior. This is the chart showing Cost of Living Adjustments (COLA) to Social Security in recent years:

I know that it’s only a coincidence that one of the biggest increases in Social Security occurred in 2011, a year before the 2012 election.

As far as Medicare is concerned, the statements are also misleading. The Republicans are not the ones who have cut Medicare. Medicare funding was cut to fund ObamaCare. On August 13, 2012, Forbes Magazine reported:

You wouldn’t know it from listening to the Obama campaign, but there’s only one Presidential candidate in 2012 who has cut Medicare: Barack Obama, whose Affordable Care Act cuts Medicare by $716 billion from 2013-2022. Today, the Romney campaign reiterated its pledge to repeal Obamacare, and promised to “restore the funding to Medicare [and] ensure that no changes are made to the program for those 55 and older.”

If any of the above is news to you, you need to reconsider where you are getting your news. If you were already aware of the above information and voted Democrat, then it is obvious that facts will not get in the way of your opinion. Facts are such inconvenient things.

An Interesting Perspective On Events In Washington

Nate Silver is a statistician who used to do baseball statistics. He took his methods of statistical analysis and applied them to the American political scene. He has been very successful in both predicting performance of baseball players and predicting political trends.

Yesterday Nate Silver posted an article at grantland.com about the impact of the government shutdown on the mid-term elections. Some of his comments on the shutdown include rather colorful language, so I suggest that if colorful language offends you, you avoid the quotes to follow and don’t follow the link to the original article.

The article points out:

However, presidential elections are more the exception than the rule. As I discuss in my book, the more common tendency instead is that people (and especially the “experts” who write about the issues for a living) overestimate the degree of predictability in complex systems. There are some other exceptions besides presidential elections — sports, in many respects; and weather prediction, which has become much better in recent years. But for the most part, the experts you see on television are much too sure of themselves.

That’s been my impression of the coverage of the shutdown: The folks you see on TV are much too sure of themselves. They’ve been making too much of thin slices of polling and thinner historical precedents that might not apply this time around.

Mr. Silver lists six observations about the government shutdown:

1. The media is probably overstating the magnitude of the shutdown’s political impact.

2. The impact of the 1995-96 shu4. The polling data on the shutdown is not yet all that useful, and we lack data on most important measures of voter preferences.tdowns is overrated in Washington‘s mythology.

3. Democrats face extremely unfavorable conditions in trying to regain the House.

4. The polling data on the shutdown is not yet all that useful, and we lack data on most important measures of voter preferences.

5. President Obama’s change in tactics may be less about a change of heart and more about a change in incentives.

6. The increasing extent of GOP partisanship is without strong recent precedent, and contributes to the systemic uncertainty about political outcomes.

The bottom line here is simple–we really don’t know how what is now happening in Washington will impact the 2014 mid-term elections. Frankly, I think many Americans are thoroughly disgusted with both political parties.

Enhanced by Zemanta