The Impact Of Inflation

On Thursday, The Center Square posted an article about the impact of inflation on homebuyers.

The article reports:

(The Center Square) – The housing market is not immune from inflationary woes as buyer’s purchasing power has significantly diminished in four years. Home buyers in 2024 need 80% more income to purchase a home than they did in 2020, according to a new report by Zillow.

“The income needed to comfortably afford a home is up 80% since 2020, while median income has risen 23% in that time,” the report states. That equates to $47,000 more than four years ago.

“Home shoppers today need to make more than $106,000 to comfortably afford a home,” according to the report. “That is 80% more than in January 2020.”

A monthly mortgage payment for a typical U.S. home has nearly doubled since January 2020, the report notes, up 96.4% to $2,188. The calculations are based on a 10% down payment.

Home values also increased over 42% in the last four years, with the typical home nationwide worth roughly $343,000, according to Zillow’s January market report. Mortgage rates in January 2020 were 3%, the report notes. By February 2024, they are closer to 7%.

The article notes:

The report’s analysis was based on quarterly median household income from the American Community Survey, Moody’s Analytics, and the Bureau of Labor Statistics’ Employment Cost Index.

The findings were announced as total household debt reached a record $17.5 trillion in the fourth quarter of 2023, according to a Federal Reserve Bank of New York report. Mortgage debt increased by $112 billion in Q4 2023 to reach $12.25 trillion. Balances on home equity lines of credit increased by $11 billion, the seventh consecutive quarterly increase after Q1 2022. There are currently $360 billion in aggregate outstanding balances, the Fed states.

The overspending of our government impacts all of us. There will eventually be a tipping point where the housing market crashes because people cannot afford to buy houses. We need to un-elect any Congressman or Senator that continues to vote for overspending.

How Is The Trump Economy Doing?

The Washington Examiner posted an article today about the impact of President Trump’s economic policies on the economy during the past two years.

The article reports:

President Trump has had a tumultuous two years in office, but as he starts to ramp up his reelection campaign, he can boast of having presided over the lowest recorded average unemployment rate of any of his predecessors at this point in their presidencies.

On Friday, the Bureau of Labor Statistics reported that the unemployment rate had held steady at 3.8%. That brings the average unemployment rate for the first 26 months of Trump’s presidency, from February 2017 through March 2019, to 4.1%.

Starting with the presidency of Dwight D. Eisenhower in 1953, there has never been a president who oversaw such a robust employment market at this point in his presidency. This is demonstrated in the chart below. The official BLS unemployment data go back to 1948, and thus is not available for the comparable period in the Harry S. Truman era or earlier.

Since the economy is a strong player in presidential elections, these numbers are important.

The article concludes:

The strong economic performance will also be a test of a lot of models predicting the outcome of elections. Many analysts rely heavily on the state of the economy when predicting whether an incumbent will get reelected. However, typically, when the economy is strong, it is also associated with a solid presidential approval rating. Yet Trump has polled consistently lower than other presidents, despite the strong economy.

For instance, take Eisenhower and Richard Nixon, whose unemployment rates came closest to Trump, at 4.4% and 4.5%, respectively. At the comparable points in their presidencies, according to Gallup, Eisenhower was polling at 71 percent and Nixon, while less popular, was still at 50%. In contrast, Trump is currently polling at 39%.

That’s why predicting the 2020 election is so perilous, especially with the Democratic nomination battle so wide open. It’s easy to come up with a scenario in which Trump loses reelection despite having the strongest presidential term for employment in recorded history, because he turns off voters in many other ways. On the other hand, it’s also possible to imagine an outcome in which the strength of the economy convinces voters to get past their objections with Trump and stay the course rather than risk radical change being promised by Democrats.

The strong economy may be the reason the Democrats are trying to get so much mileage out of the Mueller Report. It may be their only hope.

The Impact Of New York City’s New Minimum Wage

Investor’s Business Daily posted an editorial today about the impact of New York City raising the minimum wage over the past four years.

The editorial reports:

Over the past four years, the minimum wage for New York City restaurants that employ more than 10 workers went from $10.50 an hour to $15. That’s a whopping 43% increase. Next year, every restaurant, big and small, will have to pay their workers at least $15 an hour.

A big victory for workers, right? That’s how it’s depicted by the “Fight for $15” crowd. And, yes, if you held a full-time minimum-wage job over those years, your gross income would have gone up by $9,360.

But those massive wage hikes come at a painful cost that backers refuse to acknowledge. They kill jobs. Just like they’re doing right now in New York City.

In just the last three months of last year, 4,000 workers lost jobs at full-service restaurants, Bureau of Labor Statistics data show.

One of the problems here is a misunderstanding of the purpose of the minimum wage. A minimum-wage job should not be an ultimate goal. A minimum-wage job should be a way to enter into the workforce and learn some basic skills–dealing with people, being punctual, having manners, etc. Theoretically these basic skills will allow you to advance to a job that pays better than minimum wage.

The editorial continues:

Even during the Great Recession, restaurant workers didn’t suffer as much as they are now. In fact, over the course of the recession, which lasted from December 2007 to June 2009, the number of restaurant jobs in the city actually increased by 1,800.

It’s getting so bad that fast-food workers now want the city to protect them from getting fired without “just cause.”

Those who keep their jobs aren’t necessarily better off, either.

The Hospitality Alliance survey found that more than three quarters of New York restaurants cut worker hours in 2018 to offset that year’s wage hike. Seventy-five percent say they want to cut hours this year.

“Though the new regulations are intended to benefit employees, some restaurateurs and staffers say that take-home pay ends up being less due to fewer hours — or that employees face more work because there are fewer staffers per shift,” notes Tara Crowl in an article in New York Eater.

The results of a significant increase in the minimum wage in New York City are similar to the results of a significant increase in the minimum wage in Seattle and in Illinois. It seems to me that we need to stop making the same mistakes over and over again and take a good look at the results. Rather than increase the minimum wage, we should be encouraging people to learn the skills they need to get them into jobs that pay better than minimum wage. We should also realize that raising wages too high too fast will create unemployment–not wealth.

How Does This Statement Make Sense?

Yesterday I posted an article that included the following:

…Newly-elected Rep. Rashida Tlaib (D-MI) also endorsed impeaching Trump on her first day in office, according to The Nation, which described Tlaib as calling for “immediate steps” to remove the president from the White House.

“Each passing day brings more pain for the people most directly hurt by this president, and these are days we simply cannot get back. The time for impeachment proceedings is now,” Rep. Tlaib declared.

I really am confused about how this president is hurting people. I am further confused by looking at Representative Tlaib’s statement in view of some economic news that was reported today.

For instance, CNN is reporting today:

US employers added 312,000 jobs in December, well above what economists expected and underlining that the American economy remains strong despite recent market turbulence.

The unemployment rate rose to 3.9% as more people were looking for work. It had been at a 50-year low of 3.7% for two of the last three months.

Employers added 2.6 million jobs in 2018, compared to 2.2 million in 2017. Revisions to the October and November estimates added an additional 58,000 jobs to the 2018 total.

…Paychecks grew as employers raised wages to attract new workers. Average hourly pay was up 3.2% compared to a year earlier. The average number of hours people worked also edged up.

…The unemployment rate rose because more than 400,000 people joined the labor force looking for jobs. The percentage of the working-age people in the work force matched a five-year high.

“Yes, the nation’s unemployment rate rose to 3.9%, but for the best of reasons,” said Mark Hamrick, Bankrate.com senior economic analyst. “That’s a deal we’ll take if more people are participating in the workforce.”

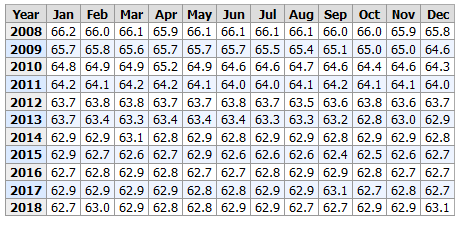
The chart that I watch to see how things are going is from the Bureau of Labor Statistics. It is the chart of the Workforce Participation Rate. It indicates how many Americans are actually part of the workforce. This is the chart:

Note that we have reached the 63.1 percent participation rate only three times since 2014. When President Obama took office, the rate was 66.2. By the time President Obama left office, the rate was 62.7. That was after the federal deficit doubled due to the stimulus package that was supposed to create jobs.

The House of Representatives has a choice–they can either join in the efforts of President Trump to improve the American economy and the lives of American workers, or they can do everything they can to slow it down. Unfortunately, the new rules they are putting in place will bring us laws and policies that will slow the economy down. That is unfortunate–Americans deserve better, even though they elected these people.

A Few Observations From The Polls

I have visited my local voting place twice today. Don’t worry–I didn’t vote twice–my husband was handing out information, and I went to provide food and moral support. While I was there, I picked up some literature from the Democrats and investigated the talking points on their local website.

This is what I learned.

Their website states:

Democrats are standing up for the American Dream: an economy and government that works for everyone, not just the few.

Found on their Twitter page:

Hi kids, this is your Mom. Remember to vote on 11/6. If Trump cuts my Social Security and Medicare I’m moving in with you!

Both these statements are totally misleading.

The American Dream is more accessible to everyone under President Trump than it was under President Obama, a Democrat. According to a Western Journal article posted December 18, 2017:

The national unemployment rate for black Americans, ages 16 and over, is the lowest it has been in 17 years, according to the Bureau of Labor Statistics.

In November 2016, the unemployment rate for black people was at 8 percent, and in November 2017 that rate dropped to 7.3 percent — a percentage not seen since the months of September, October and November 2000.

As reported by CNS News, black unemployment rate during the Bush and Obama era’s fluctuated between 7 and 17 percent.

BLS data also shows that labor force participation among African-Americans rose from 61.9 percent in November 2016 to 62.2 percent in November 2017.

Unemployment rate for the Hispanic demographic fell from 5.7 percent to 4.7 percent — the lowest it’s been in 44 years, while the unemployment rate for whites and Asians hovered around 3 percent, roughly the same as one year prior.

About Social Security cuts–none of us can predict the future, but we can draw conclusions based on past behavior. This is the chart showing Cost of Living Adjustments (COLA) to Social Security in recent years:

I know that it’s only a coincidence that one of the biggest increases in Social Security occurred in 2011, a year before the 2012 election.

As far as Medicare is concerned, the statements are also misleading. The Republicans are not the ones who have cut Medicare. Medicare funding was cut to fund ObamaCare. On August 13, 2012, Forbes Magazine reported:

You wouldn’t know it from listening to the Obama campaign, but there’s only one Presidential candidate in 2012 who has cut Medicare: Barack Obama, whose Affordable Care Act cuts Medicare by $716 billion from 2013-2022. Today, the Romney campaign reiterated its pledge to repeal Obamacare, and promised to “restore the funding to Medicare [and] ensure that no changes are made to the program for those 55 and older.”

If any of the above is news to you, you need to reconsider where you are getting your news. If you were already aware of the above information and voted Democrat, then it is obvious that facts will not get in the way of your opinion. Facts are such inconvenient things.

The Jobs Report Came Out Today

The jobs report came out today. The number I watch, and I am waiting to see change is the Workforce Participation Rate. That number is holding steady at 62.9. That is not a great number, but it is an okay number. That number reached 66 during some of early 2008, but has generally been in the 63 or 64 range most of the time since then. The other numbers on the report are really good.

CNS News is reporting the numbers today:

The Labor Department’s Bureau of Labor Statistics says a record 155,965,000 people were employed in July, the 11th record-breaker since President Trump took office 19 months ago.

“Our economy is soaring. Our jobs are booming. Factories are pouring back into our country, they coming from all over the world. We are defending our workers,” President Trump told a campaign rally in Pennsylvania on Thursday.

BLS said the economy added 157,000 jobs in July (compared with a revised 248,000 in June).

The unemployment rate edged down to 3.9 percent, as the number of employed people reached new heights, and the number of unemployed persons declined by 284,000 to 6,280,000 in July. 

Among the major worker groups, the unemployment rates for adult men (3.4 percent) and Whites (3.4 percent) declined in July. The jobless rates for adult women (3.7 percent), teenagers (13.1 percent), Blacks (6.6 percent), and Asians (3.1 percent), showed little or no change over the month. The unemployment rate for Hispanics hit a record low of 4.5 percent, down from last month’s record 4.6 percent.

There was also good news for wage-earners–in addition to the tax cut, hourly wages went up:

In July, average hourly earnings for all employees on private nonfarm payrolls rose by 7 cents to $27.05. Over the year, average hourly earnings have increased by 71 cents, or 2.7 percent.

This growth is the direct result of the policies of President Trump–the combination of deregulation, tax cuts, and domestic energy development has resulted in economic growth.


The Trump Economy Keeps Rolling Along

The Wall Street Journal posted an article today about the latest unemployment numbers. There is lots of good news.

The article reports:

The U.S. labor market was firing on all cylinders in May: the unemployment rate fell to an 18-year low, employers added jobs at a faster pace and wages modestly improved.

The unemployment rate ticked down to a seasonally adjusted 3.8%, matching April 2000 as the lowest reading since 1969, the Labor Department said Friday. Nonfarm payrolls rose a seasonally adjusted 223,000 in May, a jump from gains from March and April. Average hourly earnings ticked up to a 2.7% from a year earlier—and raises were even stronger for nonmanagers.

According to the Bureau of Labor Statistics the workforce participation rate is at 62.7. That number has fluctuated very little since January 2016. It should increase as the economy further improves.

The article further reports:

A broad measure of unemployment and underemployment that includes Americans stuck in part-time jobs or too discouraged to look for work fell to 7.6% from 7.8% the prior month. That rate, known as the U-6, remains somewhat elevated compared with the last time unemployment was similarly low. In April 2000, the broader measure was 6.9%.

Like him or hate him, Donald Trump understands what was needed to grow the American economy. I am grateful that he is helping all of us to prosper.

The article also reports:

The unemployment rate for women, 3.6% last month, was the lowest since 1953, when far smaller share of women sought jobs. The jobless rates for blacks, Latinos and those without high-school diplomas are trending near record lows.

It is amazing what has happened to the economy in the last eighteen months. I suspect that not everyone is cheering.


A Picture Of The Latest Jobs Report

This chart was posted  yesterday at The Weekly Standard:

The article reports:

“For Every 1 Person Added To Labor Force Since January 2009,” the chart reads, “10 People Added To Those Not In Labor Force.”

Please remember this chart when President Obama tells all of us in the debate tonight how many jobs he has created since he took office.

Enhanced by Zemanta