This Might Backfire

On Thursday, The U.K. Daily Mail posted an article about President Biden’s new plan to forgive student loan debt.

This is the headline from the article:

American workers – are YOU happy to pay $1,800 EACH to wipe the student debt of the privileged elite who’ll earn $52,000 a year? Because BRAD POLUMBO reveals that’s your bill for desperate Joe’s naked bribe for votes

The article reports:

‘Congratulations! I erased your student loans. Now will you vote for me?’

That’s what President Biden should have said in an email to more than 800,000 student loan borrowers – because his latest scheme to ‘forgive’ some of their $1.78 trillion in outstanding debts is nothing more than a bribe.

‘Your student loan has been forgiven because of actions my Administration took to make sure you receive the relief you earned and deserve,’ read the White House message sent to in-boxes on Tuesday.

Gee – Democrats are so generous with other people’s money.

What had these lucky few done to ‘earn’ and ‘deserve’ this multi-billion dollar ‘relief?’

Very little.

In a bit of bureaucratic sleight of hand, Biden and his dutiful ministerial assistants transformed an obscure Education Department repayment program into a brand new entitlement program.

The monthly payments of hundreds of thousands of borrowers will be capped at five percent of discretionary income, and if they pay these tiny installments for 10 to 20 years their entire remaining loan will be wiped away.

This move is aimed at college students and graduates ages 18-34. This is a demographic that is not generally supporting President Biden.

However, according to the Census Bureau, only 35 percent of people between the ages of 18 and 29 vote, and 48 percent of people between the ages of 30 and 44 vote. Almost 60 percent of people between the ages of 45 and 64 vote, and 66 percent of people over 65 vote. It is quite possible that those over the ages of 45 learned critical thinking in school–something that is rarely taught now. If the people over 45 realize that they are paying for this student loan forgiveness program, it is very possible that they will turn out to cancel the votes of the younger people benefitting from the program. It is also possible that those in the age group that will benefit will include enough people who didn’t go to college that are angry about paying for someone else’s education that they could not afford for themselves.

At any rate, please follow the link to read the entire article. It will be interesting to see if this actually works or backfires. Meanwhile, we should mention that it is entirely unconstitutional.

Grooming Our Children

In 2021, Gallop posted the following chart:

Right now in the American media culture, there is a push to accept non-traditional lifestyles as desirable. I don’t believe many Americans understand the end result of this effort.

In December 2021, Census.gov reported:

The year 2021 is the first time since 1937 that the U.S. population grew by fewer than one million people, featuring the lowest numeric growth since at least 1900, when the Census Bureau began annual population estimates.

Apart from the last few years, when population growth slowed to historically low levels, the slowest rate of growth in the 20th century was from 1918-1919 amid the influenza pandemic and World War I.

What these two charts tell us is that unless the current numbers change, the population of America will not grow in the future. Meanwhile, media efforts continue to move our children toward non-traditional sexual roles.

On Wednesday, The Epoch Times reported:

A nonbinary robot on the cartoon series “Transformers: Earth Spark” has generated a heated debate on social media with the controversy spilling over to national TV talk shows.

In a recent episode of the cartoon, Nightshade—the name of the androgynous automaton—tells a teenage girl it encounters that its preferred pronouns are “they/them.”

The girl, who is donning a purse with rainbow-colored handles and gender affirming pins, reveals that she is nonbinary too.

…In episode eight of season five of of Netflix’s “Ridley Jones,” Fred, the main character—a child bison—comes out as nonbinary to his grandmother.

The show, which is aimed at preschoolers, was canceled in March shortly after the episode aired.

In 2021, in celebration of Pride month, Hulu introduced a non-binary character in its Madagascar: A Little Wild, a spinoff of the popular movie franchise.

Odee, the character, has both zebra and giraffe attributes and consequently decides he is non binary. The cartoon saw its last episode last June, ending just before Pride month.

The article at The Epoch Times concludes:

Lori Clark, a Texas mom, told The Epoch Times, she almost “fell out of her shoes” when she happened to be walking by the television while her son was watching one of his favorite shows “Gecko’s Garage” and saw two mommy trucks in a romantic scene.

The Moonbug Entertainment cartoon, which is aimed at toddlers, is about fixing trucks and cars. The two lesbian trucks are the mothers of a character called Baby Truck.

“They are sleeping this stuff right under the parent’s nose,” said Clark, who no longer allows her son to watch the cartoon.

I used to love watching Roadrunner cartoons on Saturday morning as a child. Now I don’t think I would let a child watch anything unless I was sitting there. There is a reason that the chart above shows such an increase in non-traditional sexual roles for Generation Z–they have been and are being programmed. That is not good for them, and it is not good for America.


The following was pasted on Facebook by a friend of mine who does very good research:

Just the Facts:
Before you attack anything in this post please understand that I did research at the Smithsonian Institute and the US Census Bureau. I also researched from several historical publications, Harvard university, Oxford university, the transatlantic slave trade database, slavevoyages-org, and a few others.
Information regarding the current slave trade came from the US Department of Defense, the US State Department, the united nations, amnesty international, and a confidential paper on Russian mining.
——
History:
The historical African slave trade operated from the discovery of the New World until 1808 with a recorded exception being the slave ship “Clotilda” in 1860. There were more than 32,000 voyages that delivered more than 10 million captive slaves to the Americas.
Of the more than 10 million captive African slaves, less than 310,000 were brought to North America in what is now the USA and Canada. The vast majority went to South America and the Caribbean. More than 900,000 went to Jamaica. The first delivery of captive slaves in North America was in 1619 but slaves had been brought to the Caribbean for about 100 years before that time.
The largest slave importer in Jamaica was an ancestor of Senator Kamala Harris. Ms. Harris, contrary to her claims, does not have any verified American slaves in her ancestry. But she has at least five slaveowners in her ancestry.
Of all the Black people living in America who were born here, less than 6% can document their ancestry to people who were slaves in the United States. That is less than 1% of the current US population.
More than half of black Americans claiming to be descendants of slaves trace their slave history back to the Caribbean, including to Kamala Harris’s Jamaica.
——-
In today’s world the countries exporting the most slaves are North Korea and China. North Korea sends about 20,000 people to Russia every year to work in the Russian mines. China sends about double that amount. Of all of the people sent every year to Russia from North Korea and China the only documentation I could find showed less than 10 people (eight) ever returned to China.

Voting With Their Feet

Breitbart is reporting today that the population of the State of New York dropped by about 77,000 residents over the last year — the steepest statewide population drop in the United States.

The article notes:

New Census Bureau data released this week reveals that ten states in the U.S. saw their populations decline from 2018 to 2019. New York saw the largest decline with nearly 77,000 residents fleeing the state, helping to drop the population by about 0.4 percent.

…Likewise, Illinois lost about 51,250 residents over the last year, while West Virginia’s population declined by about 12,000 residents. About 11,000 residents fled Louisiana, 6,200 residents left Connecticut, 4,900 left Mississippi, 4,700 left Hawaii, more than 3,800 left New Jersey, about 3,600 left Alaska, and about 370 left Vermont.

In New York, between 2018 and 2019, about 45,753 foreign-born residents were added to the population, which is the lowest level of immigration to the state since 2010 and the second-lowest level in nearly 60 years, according to an Empire Center analysis published in the New York Post.

“The cost of living in New York — the high taxes, regulations, and housing costs — are making it untenable to live the American dream here,” New York City Councilman for Staten Island Joe Borelli told the Post. “It’s hard to see how this changes with progressive Democrats entrenched in government.”

The article concludes:

New York’s population decline comes as mass immigration and rapid corporate development by billionaire developers, with the approval of Mayor Bill de Blasio (D), has helped drive up rents and housing costs in New York City. The results have forced working and middle-class Americans out of the state.

Between 2005 and 2017, household incomes for single adults in New York grew by less than two percent per year, a study by the state’s comptroller found. At the same time, overall median rents in New York City increased by about four percent per year, resulting in a 61 percent rent hike for one-bedroom apartments and a 53 percent rent hike for two-bedroom apartments.

This is information you can’t ignore, even if you don’t live in one of the states that is losing population. When New York State (and probably California) finally declare bankruptcy because of bad fiscal policies, the rest of the states will be called on to bail them out. I have no idea how that will work, but I am ready to guarantee it will happen. States that practice fiscal sanity will be asked to bail out states that practice fiscal insanity. The only way that works is if the states practicing fiscal insanity are willing to change their ways. This could get very interesting.

The Economic Numbers Under President Trump

Steve Moore posted an article at Fox Business on Thursday about the economy under President Trump.

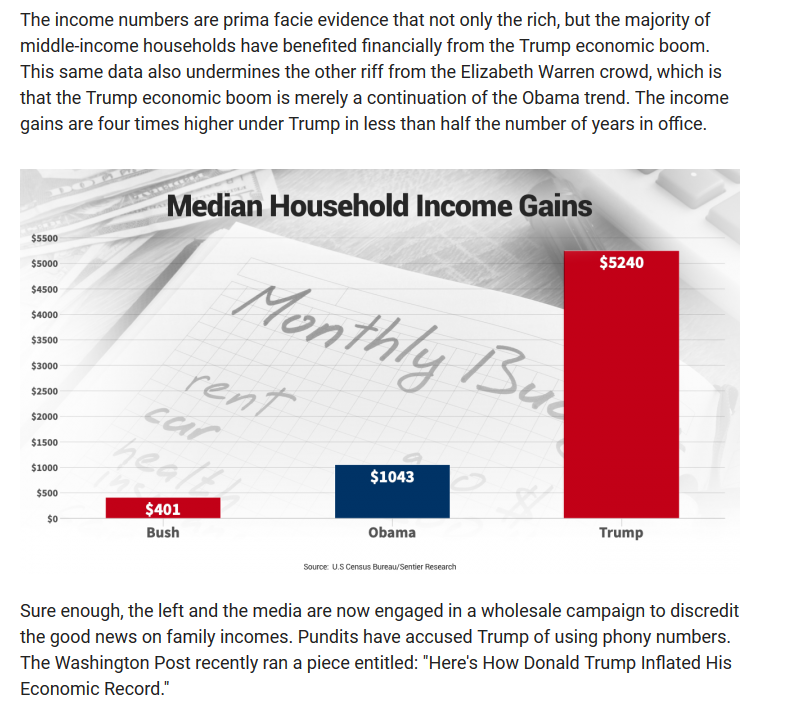
The article includes the following:

The article explains:

In one Washington Post piece, the reporter sneers of Trump’s “rambling distortions” and complains: “Trump’s numbers appear to have originated in a pair of columns from the Heritage Foundation’s Steve Moore, who used research from a private firm called Sentier Research.”

Stop right there. Yes, it is true the data comes from Sentier Research — a private firm. But what is not ever mentioned in the article is that the data come from the Census Bureau’s “Current Population Survey,” which is the gold standard of economic data.

The article concludes:

In my analysis on these numbers, I have openly admitted these monthly data are a first rough estimate of what is happening with incomes over time — just as the jobs numbers are. They catch the trends over time.

Three years into the Trump presidency there is no calamity and there is no recession. Trump is right to recite real and legitimate data that substantiates the on-going middle-class boom in America today. It isn’t Trump, but his accusers who are engaged in “rambling distortions” and who deserve Pinnochio noses.

The questions for the 2020 elections are: “Do you want your income to continue to grow, and do you want to keep more of what you earn? How much of the money you have earned are you willing to give to people who did not earn it?”

The Delusional Candidate

Yesterday One America News posted an article detailing some recent statements by presidential candidate Joe Biden.

The article reports:

Joe Biden is campaigning to roll back President Trump’s tax cuts. The former vice president made his case Wednesday in his hometown of Scranton, Pennsylvania.

Biden touted his middle class background and announced his intent to hike the corporate tax rate from 21 percent to 28 percent. He claimed the repeal would help the middle class by hitting the wealthy and corporations.

“The wealthy didn’t need [tax cuts] in the first place,” said Biden. “Corporations have spent them on stock buybacks.”

Then Joe Biden claimed that former President Obama is responsible for the current economic success in America:

“Donald Trump inherited a strong economy from Barack and me,” stated the former vice president. “Things were beginning to really move — just like everything else he’s inherited, he’s in the midst of squandering it.”

The article then notes the actual economic facts:

Recent data from the Census Bureau revealed the middle class has experienced an economic boom since President Trump took office. The average family income rose over $5,000 since 2017. Under the Obama administration, household incomes only grew by about $1,000 by the end of eight years.

The main things that increased in the Obama economy were unemployment and the number of people on food stamps. Admittedly, President Obama became President at a difficult economic time, but his policies resulted in the slowest and leanest economic recovery in American history. President Trump’s economic policies have resulted in economic growth in all segments of the economy. The middle class and all minorities are enjoying higher wages and more jobs. A return to the economic policies of President Obama would be a step backward–not a step forward.

Poverty In America

Below are the U.S. Health and Human Services Poverty Guidelines:

This is a chart from The Heritage Foundation showing changes in the poverty rate since 1959:

As you can see, the War on Poverty actually slowed down the decrease in the poverty rate that had begun in 1950.

This is a chart from Pew Research showing how the American family has changed:

First of all, living in poverty in America is not the same as living in poverty in any other part of the world.

The Heritage Foundation reports:

Because the official Census poverty report undercounts welfare income, it fails to provide meaningful information about the actual living conditions of less affluent Americans. The government’s own data show that the actual living conditions of the more than 45 million people deemed “poor” by the Census Bureau differ greatly from popular conceptions of poverty.[7] Consider these facts taken from various government reports:[8]

  • Eighty percent of poor households have air conditioning. By contrast, at the beginning of the War on Poverty, only about 12 percent of the entire U.S. population enjoyed air conditioning.
  • Nearly three-quarters have a car or truck; 31 percent have two or more cars or trucks.[9]
  • Nearly two-thirds have cable or satellite television.
  • Two-thirds have at least one DVD player, and a quarter have two or more.
  • Half have a personal computer; one in seven has two or more computers.
  • More than half of poor families with children have a video game system such as an Xbox or PlayStation.
  • Forty-three percent have Internet access.
  • Forty percent have a wide-screen plasma or LCD TV.
  • A quarter have a digital video recorder system such as a TIVO.
  • Ninety-two percent of poor households have a microwave.

I think it’s time to examine closely the impact of the War on Poverty. One of the differences between business and government is that in business when something doesn’t work, you fix it. In government when something doesn’t work, you simply add more money to it. It is obvious which solution is more effective.

The goal of any poverty program should be to help people develop self-reliance and get out of the poverty program. Obviously that is not happening–we have generations of welfare recipients. Another goal of any poverty program should be to support the family unit. Obviously our current welfare programs do not do that. It’s time to reevaluate and redo our poverty programs–they are breaking the budget and not accomplishing their goals.

In March 2013, The Brookings Institute posted the following three rules to avoid poverty:

First, many poor children come from families that do not give them the kind of support that middle-class children get from their families. Second, as a result, these children enter kindergarten far behind their more advantaged peers and, on average, never catch up and even fall further behind. Third, in addition to the education deficit, poor children are more likely to make bad decisions that lead them to drop out of school, become teen parents, join gangs and break the law.

In addition to the thousands of local and national programs that aim to help young people avoid these life-altering problems, we should figure out more ways to convince young people that their decisions will greatly influence whether they avoid poverty and enter the middle class. Let politicians, schoolteachers and administrators, community leaders, ministers and parents drill into children the message that in a free society, they enter adulthood with three major responsibilities: at least finish high school, get a full-time job and wait until age 21 to get married and have children.

Our research shows that of American adults who followed these three simple rules, only about 2 percent are in poverty and nearly 75 percent have joined the middle class (defined as earning around $55,000 or more per year). There are surely influences other than these principles at play, but following them guides a young adult away from poverty and toward the middle class.

Those three rules should be the foundation of any poverty program.

This Is Important Because It Determines Electoral College Votes And Congressional Seats

The Gateway Pundit posted an article today about a decision by US District Judge Dabney Friedrich.

The article reports quotes a CNN article:

US District Judge Dabney Friedrich declined to issue a preliminary injunction requested by a privacy and civil liberties nonprofit group, the Electronic Privacy Information Center.

The group argued that the US Census Bureau was required to complete a privacy impact assessment before Commerce Secretary Wilbur Ross announced the addition of the question.

In response, the government acknowledged it is required to update its privacy impact assessments, but must do so before collecting census responses, rather than before deciding what questions would appear.

The court sided with the government, with much of the technical, 20-page decision centered on the question of when the law requires the assessment to be completed. The ruling also suggested the group would have been more persuasive if it had asked the court to require a privacy impact assessment be performed, rather than halt the citizenship question.

“The Bureau did not act contrary to the E-Government Act by deciding to collect citizenship data before conducting, reviewing, or releasing a PIA addressing that decision,” Friedrich wrote.

The Electronic Privacy Information Center said in a statement it “intends to press forward with” its lawsuit.

The lawsuit is in the US District Court for the District of Columbia and is one of at least seven challenging the citizenship question. It is the only one focused primarily on privacy grounds.

Why is this important? The number of members each state has in the House of Representatives is supposed to be determined by the number of Americans living in the state. When illegal immigrants are included in that number, a state will be over represented in Congress and since the number of Congressmen from a state determines the number of votes in the Electoral College, the state will also be over represented there. In other words, the votes of American citizens will be diluted by the votes of non-citizens. Since most illegals seem to congregate in left-leaning states, counting them as citizens gives the Democrats more votes in Congress. That explains why the Democrats are unwilling to secure the borders and why the Democrats oppose a citizenship question on the census.

The following tweet explains the situation very well:

Misleading Propaganda From The United Nations

Yesterday The Daily Signal posted an article about the latest numbers on worldwide poverty.

The article reports:

Philip Alston, the United Nations’ special rapporteur on extreme poverty and human rights, recently reported that in the United States, “[a]bout 40 million live in poverty, 18.5 million in extreme poverty, and 5.3 million live in third-world conditions of absolute poverty.”

He further argued before the U.N. Human Rights Commission that “one of the world’s wealthiest countries does very little about the fact that 40 million of its citizens live in poverty.”

That would be very serious if it were true. Thankfully it is not.

The article further reports:

Such claims do have a veneer of legitimacy, however, because when compiling the U.S. government’s official poverty statistics, the Census Bureau considers only the cash income each family reports in an annual survey.

These “official” income figures exclude substantial off-the-books earnings among low-income households and omit roughly 95 percent of the $1.1 trillion U.S. taxpayers provide in means-tested cash, food, housing, and medical benefits for low-income persons each year.

Fortunately, the Census Bureau also conducts, on behalf of the Bureau of Labor Statistics, a survey of household expenditures, in which families are asked to report how much money they spend each month on each of up to 594 categories of purchases. Poor families routinely report spending an average of $2.40 for each dollar of official cash income.

…Alston claims that 40 million Americans have incomes below the official U.S. poverty level of roughly $24,000 per year for a family of four. However, the reality is that at most 25.9 million Americans live in poverty, based on reported spending less than the official poverty threshold. And, the official U.S. poverty threshold is far higher than the living standard for most of the world’s population.

The article explains what poverty looks like in America:

The severe shortcomings of income-based poverty measures are made clear when one considers the actual living conditions of those whom Alston considers to be in “extreme poverty.” American families living in “extreme poverty” typically have air conditioning, computers, DVD players, and cellphones. They rarely report material hardships such as hunger, eviction, or having utilities cut off.

The article notes that we need to find a better way of compiling our poverty statistics in America so that they actually reflect the truth. An accurate reporting of poverty statistics would help the government gauge exactly what our spending on poverty needs to be.

Fraud In The Census Bureau

John Crudele has been reporting on fraud in the Census Bureau for the past six months. His work has been posted at The New York Post website. His latest story deals with data on unemployment and inflation being falsified by a data collector named Julius Buckmon.

The article in the New York Post explains how this false data impacts the reports we hear on the news:

Because the Census Bureau’s surveys are scientific — meaning each answer, in the case of the jobless survey, carries the weight of about 5,000 households — Buckmon’s actions alone would have given inaccurate readings on the economic health of 500,000 families.

Buckmon alleged that he was told to fudge the data by higher-ups. There was no formal probe back then into what Buckmon was doing or what he was alleging, although a Census investigator — who is now under indictment for other crimes against the bureau — did question a few people.

A source told me from the start of my investigation last October that Buckmon’s actions weren’t isolated and that falsification continued in the Philadelphia office right through the 2012 presidential election, only stopping when I exposed the practice last fall.

This is not acceptable. Mr. Crudele also reports that some of the people who work for the Census Bureau are talking to the Office of Inspector General (OIG) and the House Oversight Committee about their allegations. The OIG, Oversight Committee and several others will be investigating the claims of these workers.

The story in the New York Post goes on to explain exactly how the fraud is taking place. Please follow the link to the article to learn more about how the numbers in the jobs report are being falsified.

Enhanced by Zemanta

Changing The Parameters To Mask The Results

Today’s New York Times is reporting that the Census Bureau, an agency which President Obama brought into the sphere of the White House, is changing the way it reports health insurance date. The change will make it more difficult to measure the impact of ObamaCare in the report due out this fall.

The article reports:

The changes are intended to improve the accuracy of the survey, being conducted this month in interviews with tens of thousands of households around the country. But the new questions are so different that the findings will not be comparable, the officials said.

An internal Census Bureau document said that the new questionnaire included a “total revision to health insurance questions” and, in a test last year, produced lower estimates of the uninsured. Thus, officials said, it will be difficult to say how much of any change is attributable to the Affordable Care Act and how much to the use of a new survey instrument.

“We are expecting much lower numbers just because of the questions and how they are asked,” said Brett J. O’Hara, chief of the health statistics branch at the Census Bureau.

Can you pick out the taking points?

This will, of course, mute the effectiveness of attacks on ObamaCare in the fall election.

Enhanced by Zemanta

Changing The Numbers To Fit The Situation

Remember when 5 percent unemployment under George W. Bush meant that we were in horrible economic straits? Remember when gas prices hit $3.00 a gallon under George W. Bush and it was the end of the American economy as we knew it? Anyone else long for those days?

We are being told that the unemployment rate is currently hovering around 7 percent. We are also watching the labor participation rate fall to 62.8 percent (Investor’s Business Daily). This puts the true unemployment rate at about 11.8 percent.

Investor’s Business Daily reports:

When the economy fell into recession in December 2007, the jobless rate was 5% and the labor force participation rate was 66%. As job losses surged, unemployment doubled to 10% in October 2009, a few months after the recession officially ended. The jobless rate slowly began to edge down, but held at 9% or above for nearly two years, and above 8% for nearly three years.

But the drop largely reflected job market weakness rather than strength. During this time, labor force participation steadily fell. In October 2009, when official unemployment peaked, participation was 65%. A year later it was 64.4%. Now, more than four years into the expansion, it’s 62.8%, the lowest in 35 years.

But wait–there’s more. The New York Post reported yesterday that Congress will begin an investigation on how unemployment numbers have been calculated and released particularly during the run-up to the 2012 election.

The article at the New York Post reports:

Last week I reported exclusively that someone at the Census Bureau’s Philadelphia region had been screwing around with employment data. And that person, after he was caught in 2010, claimed he was told to do so by a supervisor two levels up the chain of command.

On top of that, a reliable source whom I haven’t identified said the falsification of employment data by Census was widespread and ongoing, especially around the time of the 2012 election.

In 2009, before the 2010 census was taken, the White House changed the rules on how the census would be reported. The Census Bureau would report to senior White House aides. I will admit that at the time I thought this would result in some population statistics being altered to increase the number of votes in blue states and decrease the number of votes in red states. It didn’t occur to me at the time that these numbers could also be used to skew unemployment data.

The New York Post continues:

Back in 2010, I started getting reports that the Census Bureau had some very unusual hiring practices. Census takers and supervisors — at risk of heavy fines — were reporting to me that large numbers of people were being hired only to be fired shortly afterward. And then rehired.

I theorized at the time that Census was trying to make the job-creation totals look better nationwide in those bleak months leading up to the midterm congressional elections.

This employment policy seemed too coordinated. The regional higher-ups at Census couldn’t be doing this on their own; there had to be a grander plan.

I still don’t know what was going on.

But then I heard about the falsification in Philly. This time, however, it wasn’t the employment numbers that were being doodled with. This time it was the unemployment data, which are gathered at the Census Bureau and handed over raw to the Labor Department.

Please follow the link and read the entire story. Unfortunately most of the media is unaware of this or ignoring it. As voters, all of us need to be aware of what is taking place here.

Enhanced by Zemanta

News That Really Does Not Make Me Happy

Bloomberg reported yesterday that incomes in America declined more in the three year expansion since 2009 than during the longest recession since the Great Depression. The ‘great recession’ in America officially ended in 2009. There is a technical definition of a recession, and according to that definition, the recession in America ended in 2009. However, the income and unemployment numbers for Americans have not improved.

The article reports:

“Almost every group is worse off than it was three years ago, and some groups had very large declines in income,” Green (Gordon Green, Sentier Research LLC.), who previously directed work on the Census Bureau’s income and poverty statistics program, said in a phone interview today. “We’re in an unprecedented period of economic stagnation.”

While gains in hourly earnings and average hours worked per week may have had “a minor mitigating effect” on income declines, they couldn’t offset a jobless rate that hasn’t fallen below 8 percent since February 2009 and a record duration of unemployment, according to the Annapolis, Maryland-based firm.

The average duration of unemployment increased to a record 41 weeks in November and remains at 39 weeks, Labor Department data show. Almost 5.2 million Americans have been out of work for at least six months.

This snapshot of the economy does not bode well for the re-election chances of Barack Obama.

Enhanced by Zemanta