Is The Misery Index Back?

In the 1970’s Chicago Economist Robert Barro coined the phrase ‘misery index.’ The phrase was used to describe a number obtained by adding the unemployment rate to the inflation rate. During the Carter administration, that number ranged between 12 and 17 percent. During the Trump administration, that number ranged between 5 and 7 percent. I shudder to think where it is headed during the Biden administration.

Yesterday The New York Post posted an article about the current rate of inflation.

The article reports:

Inflation continued to surge in July, but appeared to settle close to the fastest pace in almost 13 years as the economy continues to emerge from the pandemic, the feds said Wednesday.

The Labor Department’s Consumer Price Index, which measures a basket of goods and services as well as energy and food costs, jumped 5.4 percent in July from a year earlier.

That’s the same as June’s 5.4 percent year-over-year rise in prices, which marked the biggest 12-month rise since August 2008, just before the financial crisis sent the US into the worst recession it had seen since the Great Depression.

Consumer prices rose 0.5 percent from the month prior, the Labor Department said.

Economists surveyed by Dow Jones expected a 5.3 percent year-over-year spike in July and monthly increase of 0.5 percent.

The core consumer price index, which excludes volatile food and energy costs, rose 4.3 percent from a year ago, lower than the 4.5 percent year-over-year jump that the index saw in June, which marked the fastest acceleration since 1991.

The article concludes:

Federal Reserve officials have so far maintained their position that inflation is mostly temporary and will likely subside this year. They’ve cited this as a reason why they haven’t yet pulled back on their economic support measures like the bond-buying program.

Last week’s July jobs report showed that the country added a whopping 943,000 jobs in the month, more than expected, in a sign that the labor market recovery could finally be gaining steam.

Fed officials have said they will look for more confirmation of that in the next few jobs reports before a tapering of their financial support measures will be considered.

“I think this keeps taper talk on the table because inflation is staying relatively high and transitory may mean a little longer,” Minopoli said.

“If the supply chain kinks and businesses raising prices remains sustained, ‘transitory inflation’ might be a little less transitory than Fed Chair Powell will like and the hawks at the Fed may push a little harder on timing and speed of taper,” he added.

I remember the 1970’s–gas lines and all– and I don’t want to go back there.

The Past Six Month In Charts

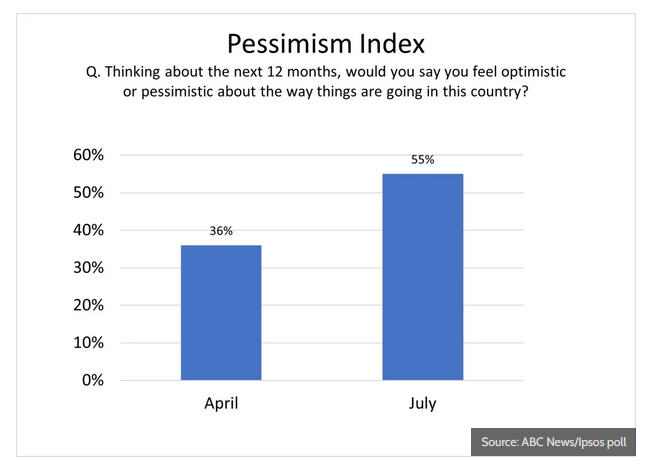
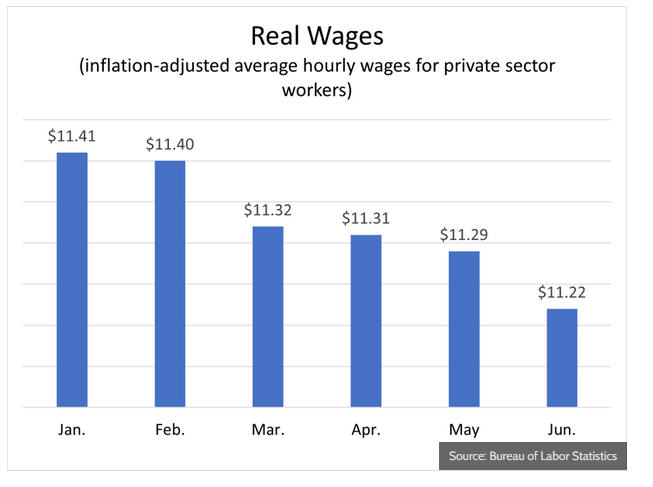
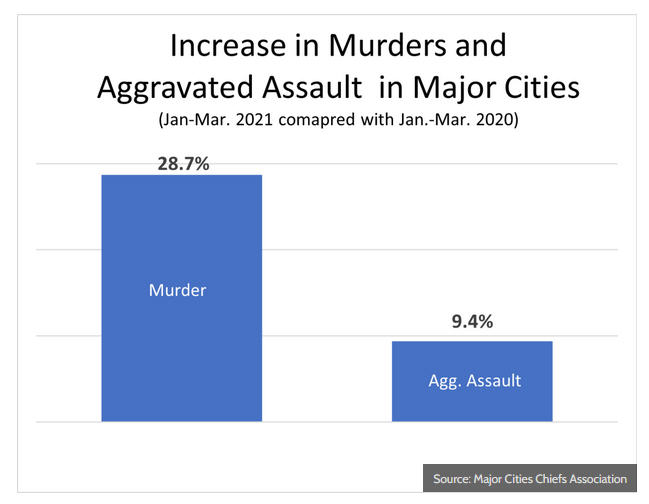
Issues & Insights posted an article today about President Biden’s first six months in office. The article included eight charts to illustrate what the first six months has brought us.

Here are the charts:

Please follow the link above to read the entire article.

The article concludes:

It is true that Biden has been in office for only six months. It’s also true things could turn around. But we don’t see that happening unless Biden changes course.

We have no doubt that Biden was very much hoping one day to tell the public how he killed COVID and saved the economy (just as he once bragged that “Osama bin Laden is dead and General Motors is alive” while he and President Barack Obama where in the White House).

The way things are going right now, Biden might one day have to admit that “the economy is dead, but COVID is alive.”

What The Republican Debates Should Really Be About

This chart is from the website of the House Ways and Means Committee

America Before President Obama Took Office and Now

  Before Now Change
Number of Unemployed1 12.0 Million 13.1 Million +9%
Long-Term Unemployed2 2.7 Million 5.6 Million +107%
Unemployment Rate3 7.8% 8.5% +9%
“High Unemployment” States4 22 43 +95%
Misery Index5 7.83 11.46 +46%
Price of Gas6 $1.85 $3.39 +83%
“Typical” Monthly Family Food Cost7 $974 $1,013 +4%
Median Value of Single-Family Home8 $196,600 $169,100 -14%
Rate of Mortgage Delinquencies9 6.62% 10.23% +55%
U.S. National Debt10 $10.6 Trillion $15.2 Trillion +43%

1 Number of unemployed in January 2009 and December 2011. http://www.bls.gov/data/#unemployment.
2 “Long-term unemployed” means for over 26 weeks; data for January 2009 and December 2011. http://www.bls.gov/data/#unemployment.
3 Unemployment rates in January 2009 and December 2011. http://www.bls.gov/data/#unemployment.
4 “High unemployment” means having a 3-month average unemployment rate of 6% or higher.  From the Bureau of Labor Statistics’ “Extended Benefits Trigger Notice” for January 18, 2009 and January 22, 2012. http://www.ows.doleta.gov/unemploy/trigger/2009/trig_011809.html and http://ows.doleta.gov/unemploy/euc_trigger/2012/euc_012212.html.
5 The “Misery Index” equals unemployment plus inflation.  For January 2009 and December 2012.  http://www.miseryindex.us/indexbymonth.asp.
6 Average retail price per gallon, January 2009 week 3 and January 2012 week 4. http://www.eia.gov/dnav/pet/hist/LeafHandler.ashx?n=PET&s=EMM_EPMR_PTE_NUS_DPG&f=W.
7 U.S. Department of Agriculture, values represent monthly “moderate” cost per family of four for January 2009 and November 2011. http://www.cnpp.usda.gov/USDAFoodCost-Home.htm.
8 U.S. median sales price of existing single-family homes for metropolitan areas for 2008 and 2011 Q3. http://www.realtor.org/research/research/metroprice.
9 Residential mortgage delinquencies (real estate loans) for 2008 Q4 and 2011 Q3. http://www.federalreserve.gov/releases/chargeoff/default.htm.
10 Values for January 21, 2009 and January 23, 2012.  http://www.treasurydirect.gov/NP/BPDLogin?application=np

This is where the focus of the debates should be.


Enhanced by Zemanta