
As President Obama goes around the country praising the economic growth in America, there is another side of the story.
Yesterday, John Hinderaker at Power Line posted the following charts:


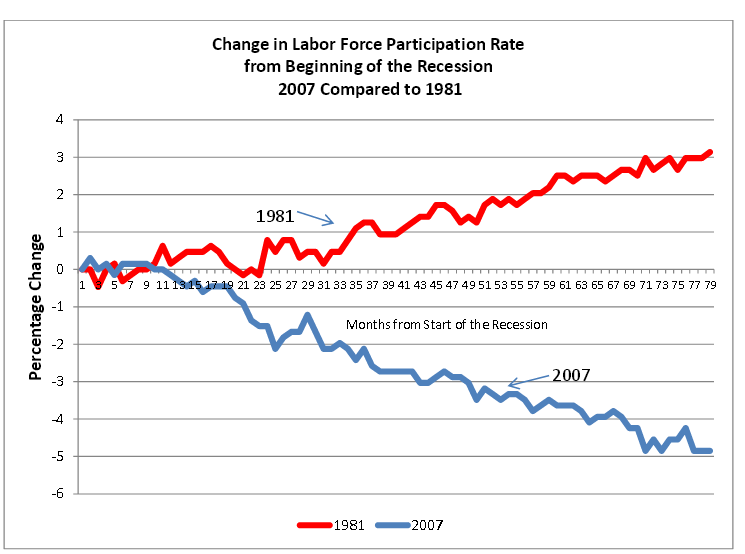
The charts are taken from a booklet put out by the Republicans on the Senate Budget Committee. The booklet includes another chart which explains the low unemployment numbers that were released today–the workforce has significantly decreased. If the unemployment rate reflected the number of workers that have left the work force, the number would be considerably higher.
 Please follow the link above to the booklet to see the eleven charts that explain what is happening to the American economy and to the Middle Class in America.