The Impact Of Inflation

On Thursday, The Center Square posted an article about the impact of inflation on homebuyers.

The article reports:

(The Center Square) – The housing market is not immune from inflationary woes as buyer’s purchasing power has significantly diminished in four years. Home buyers in 2024 need 80% more income to purchase a home than they did in 2020, according to a new report by Zillow.

“The income needed to comfortably afford a home is up 80% since 2020, while median income has risen 23% in that time,” the report states. That equates to $47,000 more than four years ago.

“Home shoppers today need to make more than $106,000 to comfortably afford a home,” according to the report. “That is 80% more than in January 2020.”

A monthly mortgage payment for a typical U.S. home has nearly doubled since January 2020, the report notes, up 96.4% to $2,188. The calculations are based on a 10% down payment.

Home values also increased over 42% in the last four years, with the typical home nationwide worth roughly $343,000, according to Zillow’s January market report. Mortgage rates in January 2020 were 3%, the report notes. By February 2024, they are closer to 7%.

The article notes:

The report’s analysis was based on quarterly median household income from the American Community Survey, Moody’s Analytics, and the Bureau of Labor Statistics’ Employment Cost Index.

The findings were announced as total household debt reached a record $17.5 trillion in the fourth quarter of 2023, according to a Federal Reserve Bank of New York report. Mortgage debt increased by $112 billion in Q4 2023 to reach $12.25 trillion. Balances on home equity lines of credit increased by $11 billion, the seventh consecutive quarterly increase after Q1 2022. There are currently $360 billion in aggregate outstanding balances, the Fed states.

The overspending of our government impacts all of us. There will eventually be a tipping point where the housing market crashes because people cannot afford to buy houses. We need to un-elect any Congressman or Senator that continues to vote for overspending.

Bidennomics At Work

On September 12, The Washington Examiner reported the following:

Median household incomes peaked at $78,250 in 2019, the year before the pandemic. They declined in 2022 to $74,580, a year that saw inflation soar, undercutting household purchasing power.

“Despite nominal gains, historically high inflation resulted in a decline in real median household income,” said Liana Fox, assistant division chief for economic characteristics in the Census Bureau’s Social, Economic, and Housing Statistics Division.

That’s about a $300 a month decrease.

The article continues:

The figures released on Tuesday showed that poverty was flat, with about 11.5% of the population, or 38 million people, below the poverty line, which was $29,678 for a family of four.

The bureau also reported a jump in child poverty by one metric, the supplemental poverty measure, or SPM, from 5.2% to 12.4%. The increase was attributable in large part to the expiration of the temporary expanded child tax credit implemented by Democrats and President Joe Biden as a form of pandemic relief. The SPM, unlike the official poverty measure, includes tax credits in calculating household resources.

The question that needs to be asked in next year’s election is, “Are you better off now than you were four years ago?”

The Numbers Tell The Story

On Wednesday, Just the News posted an article about some recently-released Census Data.

The article reports:

As he heads into the final stretch of the election, President Trump is getting a boost from new census data showing historic, broad-based economic gains for U.S. households in 2019.

The U.S. Census Bureau on Monday released data showing median household income surging to a record high of more than $68,700 last year. The increase of 6.8% in household income was the largest one-year increase on record.

The poverty rate, meanwhile, fell to 10.5% last year, a record low, with 4.2 million Americans lifted out of poverty last year, the largest decrease in poverty since 1966.

The article notes:

Median household incomes for African-AmericansHispanics, and Asian-Americans all hit record highs last year, along with a record-high median income for women. The income gains for blacks, Hispanics, and Asian-Americans were all one-year record increases. According to the Council of Economic Advisers, “the poverty rate fell to an all-time record low for every race and ethnic group in 2019,” and the child poverty rate hit a 50-year low.

At the White House, Trump noted that the new census data showed income inequality has fallen over the last two years. He noted that COVID-19 presented challenges during 2020 to American households but predicted a robust economic recovery, which to date has exceeded many economists’ forecasts.

I guess those ‘tax cuts for the rich’ didn’t only help the rich!

One of the ways that people who support socialism move a country in the direction of socialism is to eliminate the middle class. In a socialist county, the ruling class is extremely wealthy and everyone else lives in poverty. Many of our political leaders have been moving America in that direction for years. One of the reasons for the irrational hatred directed at President Trump is that he is reversing that trend–thus he is a threat to their power and ultimate plan. Many of our political and media elites really do not have the best interests of the average America at heart. They are interested in their own success and really don’t care about doing things that will benefit the rest of us.

What Happens If The Trump Tax Cuts Are Repealed?

Yesterday The Washington Examiner posted an opinion piece with the following title, “Democrats want to repeal most important part of Trump’s tax cuts.”

I would like to note at this point that according to CNS News:

The federal government set records for both the amount of taxes it collected and the amount of money it spent in the first four months of fiscal 2020 (October through January), according to data released today in the Monthly Treasury Statement.

So revenue has increased under the tax cuts–not decreased.

The piece at The Washington Examiner continues:

Democrats are vowing to repeal the GOP’s 2017 tax reform bill, starting with raising the corporate income tax. The Democrat-controlled House Ways and Means Committee recently held a hearing laying the groundwork for this tax increase, falsely claiming that the corporate rate was lowered at the expense of middle-class families.

Reality belies this rhetoric. The corporate tax reduction from 35% to 21% has benefited families and workers alike by growing the economy, raising wages, and creating new jobs.

It’s no coincidence that, in the two years since the tax cut, unemployment has dropped to a 50-year low. It has hit all-time lows for key demographics including women, African Americans, and Hispanics. Thanks to these pro-growth policies, nearly seven million jobs have been created since Trump took office, and there are now fewer unemployed people than job openings.

Wages have also grown.

Annual hourly earnings have grown by 3% or more in the past 12 months. In fact, real median household income has increased by over $5,000 during Trump’s tenure, according to data released by Sentier Research. In addition to this wage growth, the tax cuts have allowed businesses to expand, hire new workers, and increase pay and benefits.

Savings are also on the rise.

When Trump was elected president, the Dow Jones sat at 18,332. It is now at roughly 29,000, an increase of about 60%. This stock market growth benefits the 100 million 401(k)s, the 46.4 million households that have an individual retirement account, and the nearly $4 trillion in public pension funds, half of which is invested in stocks.

And the Congressional Budget Office has revised revenue up by over $1.2 trillion, 80% of the cost of the tax cuts, due to improving economic conditions since the tax cuts were passed.

You have to wonder why the Democrats would want to undermine an economy that is obviously working for everyone. If federal revenue is at record levels, why would you change things?

The piece concludes:

Utility savings for households are another benefit of the corporate rate reduction. As a direct result of the corporate rate cut, utility companies in all 50 states reduced their prices. That means lower monthly electric, gas, and water bills for households and businesses. If Democrats raise the corporate rate, they will be saddling households with higher utility bills.

The Left won’t stop there, either.

Democrats have proposed trillion-dollar annual tax increases that include payroll tax increases, small-business tax increases, income tax increases, and even an increase in the “death tax.” The fact is, corporate tax cuts have grown the economy, lifted wages, and created more jobs. Democrats would undo these gains and harm middle-class families.

Are the Democrats economically ignorant, or do they simply not care about the impact of their policies on everyday Americans?

A Really Good Idea

On October 24, The Federal Times posted an article about relocating some of the Washington bureaucracy. What a great idea. We need to move some of the people in charge of government agencies closer to the people they are supposed to serve. We also need to break up the concentration of power that is the Washington swamp.

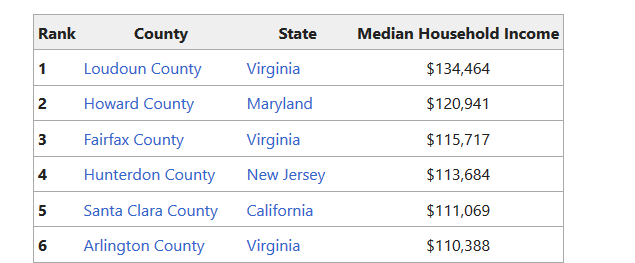
It is not a coincidence that many of the wealthiest counties in America are suburbs of Washington, D.C.

According to Wikipedia (a questionable source, but I suspect this is correct):

Presented below are the 25 highest-income counties (with populations of 65,000 or greater) in the United States by median household income according to the 2016 American Community Survey[4] prepared by the US Census Bureau. Five of the counties are located in the state of Maryland, five are in Virginia, four in California, three in New Jersey, two in New York, and one each in: Colorado, Georgia, Massachusetts, Ohio, Tennessee, and Texas. (Disclaimer: This only includes counties that participated in this single survey)

The Federal Times reports:

The Trump administration’s decision to move three agency components outside the Washington, D.C., metropolitan area has spurred a sizeable amount of controversy, but Sens. Josh Hawley, R-Mo., and Marsha Blackburn, R-Tenn., want to keep going with that trend.

The two senators introduced a bill Oct. 23 that would move about 90 percent of the workforce at the headquarters for 10 federal agencies to other states around the country and pop the “bubble” of D.C. federal employment.

“Every year Americans’ hard-earned tax dollars fund federal agencies that are mainly located in the D.C. bubble. That’s a big part of the problem with Washington: they’re too removed from the rest of America,” said Hawley in a news release.

“The HIRE Act will move policymakers directly into the communities they serve, creating thousands of jobs for local communities and saving taxpayers billions of dollars along the way.”

Under the proposal, the Department of Agriculture would move to Missouri, Commerce to Pennsylvania, Education to Tennessee, Energy to Kentucky, Health and Human Services to Indiana, Housing and Urban Development to Ohio, Interior to New Mexico, Labor to West Virginia, Transportation to Michigan and Veterans Affairs to South Carolina.

Obviously there are objections to this idea. The swamp is not enthusiastic about being split up!

The article concludes:

About 20 percent of D.C. residents are employed directly by the federal government, according to OPM and population data, while each of the 10 states slated for agency relocation under the bill have about .3 to one percent of their populations working for the federal government.

But Washington has an incredibly small population when compared with these states, and even if the entire D.C. federal workforce were to be relocated equally across the 10 states, the state with the lowest percent of federal workforce, Michigan, would only move from .3 percent to .4 percent.

The bill is bound to get strong pushback not only from the Democratically controlled House, which has been opposed to many of the Trump administration’s smaller moves, but also from the Virginia and Maryland members of Congress, whose states and districts would be likely to lose a number of jobs due to a relocation.

Relocation might also clear up the incredible traffic jam that is Washington, D.C. I suspect that it also would be cheaper to run government agencies in places where renting or owning office space would be considerably lower.

This will probably never happen, but it is a great idea.

Consequences Of Good Economic Policy

On Friday, Investor’s Business Daily posted an editorial about The Heritage Foundation’s 25th annual “Index of Economic Freedom.”

The editorial reports:

In just one year, the U.S. climbed six places to 12th worldwide on the Heritage Foundation’s 25th annual “Index of Economic Freedom.” The U.S. index score of 76.8 is the highest since 2011, the report says.

Heritage bases its annual rankings on a dozen different measures of economic freedom, such as tax burden, protection of property rights, tax burden trade policies, labor laws, judicial effectiveness.

…In fact, during Obama’s tenure, the U.S. plunged from 6th place down to 18th on the Heritage freedom rank, in the wake of tax hikes and massive new financial, insurance and environmental regulations.

The editorial explains the importance of these ratings:

Why do these rankings matter? As Heritage explains, there’s a clear correlation between economic freedom and prosperity. The freer an economy is, the more prosperous its people.

Heritage finds that in countries consistently rated “free” or “mostly free,” average incomes are twice that of all other countries, and five times that of “repressed” economies.

The most striking example of the connection between freedom and prosperity is Venezuela. One of the wealthiest countries in South America before socialist dictator Hugo Chávez took control, Venezuela is now racked with hyperinflation, starvation, and political chaos.

But you can see the same impact in the U.S. as well.

The editorial concludes:

And the benefits of this growth are widespread. The unemployment rate was just 3.9% at the end of the year. The job market is so vibrant right now that it’s pulling people off the sidelines to look for work. In fact, the number of people who aren’t in the labor force actually declined last year. That hasn’t happened since 1996 — which was in the middle of the Clinton boom. Wage growth is accelerating, and median household incomes are at record highs.

The freedom index is a powerful reminder that while redistributionist policies — like those currently in favor among Democrats — might be emotionally satisfying, they won’t grow the economy or boost prosperity.

It will be interesting where our rating is next year in view of the fact that the Democrats now control the House of Representatives.

Truth Is Always The First Casualty Of An Election Campaign

President Obama is not running for office this year. However, he has not hesitated to tell anyone who will listen what a great President he has been. Some of us aren’t convinced.

On Friday, The New York Post posted an article about President Obama’s recent claims about the economy.

The article states:

‘Anybody who says we are not absolutely better off today than we were just seven years ago, they’re not leveling with you. They’re not telling the truth,” Obama said last week. “By almost every economic measure, we are significantly better off.”

The article then goes on to report some of the actual statistics:

  • The labor force participation rate over that period has slid from 65.7 percent to 62.9 (the lowest reading since March 1978) — down 4.3 percent.
  •  On Obama’s watch, the percentage of Americans below the poverty line has grown, according to the most recent Census data, from 14.3 percent to 14.8 percent in 2014 — up 3.5 percent.
  •  Real median household income across that interval sank from $54,925 to $53,657 — down 2.3 percent.
  • Food Stamp participants soared in that time frame from 32,889,000 to 45,874,000 — up 39.5 percent.
  •  Meanwhile, from Obama’s arrival through the fourth quarter of 2015, the percentage of Americans who own homes sagged from 67.3 percent to 63.8 — down 5.2 percent.

I don’t think we can afford another four years of this sort of economic success.

A Picture Is Worth A Thousand Words

Zero Hedge has posted nine charts that clearly show what President Obama’s economic policies have done to the American economy and those of us who try to exist in it.

Here are the charts:

EconomicCharts2015

If you follow the link above to the site, you can make the charts larger. It really is not a pretty picture.

Where Has All The Money Gone?

Below is a chart posted by Ed Morrissey at Hot Air today:

fred-dc-usa-medianincome

The chart above shows the median household income of the Washington, D.C., area versus the median household income of the rest of the nation.

The article at Hot Air points out a few things about the graph:

From the mid-1980s to around 2007, the median household income rise in DC remained pretty closely linked to that of the nation as a whole.  Anyone remember what happened in 2007, besides the economic slowdown that would turn into the Great RecessionDemocrats took control of Congress and federal spending shot upward ever since.  And at least according to the Fed, that disparity is actually accelerating,  at least to 2012, with DC median income skyrocketing while the rest of us stagnate.

We have a choice to make as Americans. It’s not a Democrat or a Republican choice–it’s an American choice. Do we keep spending ourselves into bankruptcy or do we begin to act like adults and live within our means? The choice is ours. We have an election coming up in about a year. Forget party labels–they really aren’t worth much right now. Find out what the candidate’s position is on spending and formulating a federal budget (we haven’t had one since 2009). Find our what the candidate’s past voting record is on fiscal matters. These things are not hard to find. Thomas.gov is an excellent source of information for votes, sponsors of legislation, and actions of past Congresses. Do your homework–your country depends on it.

Enhanced by Zemanta