A Positive Economic Picture

CNS News is reporting today that the economy is doing better than predicted.

The article reports:

A record 157,005,000 people were employed in June, the most since February and the 19th record of Trump’s presidency, the Bureau of Labor Statistics reported on Friday.

And the economy added a strong 224,000 jobs in June, well above the estimate of 160,000.

The unemployment rate, the lowest in 50 years, ticked up a tenth of a point to 3.7 percent.

In June, the nation’s civilian noninstitutionalized population, consisting of all people age 16 or older who were not in the military or an institution, reached 259,037,000. Of those, 162,981,000 participated in the labor force by either holding a job or actively seeking one.

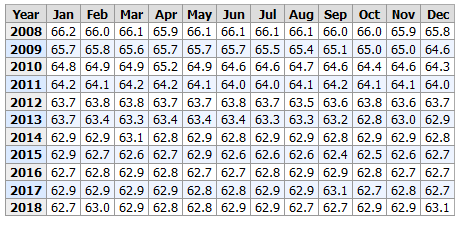
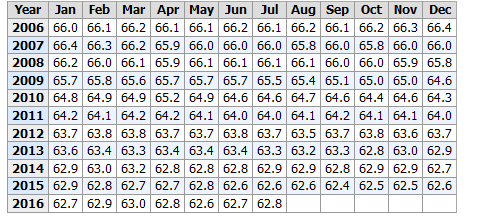
The 162,981,000 who participated in the labor force equaled 62.9 percent of the 259,037,000 civilian noninstitutionalized population. That’s up a tenth of a point from May’s 62.8 percent participation rate. The payroll taxes paid by people who participate in the labor force help support those who do not participate, so the higher this number, the better.

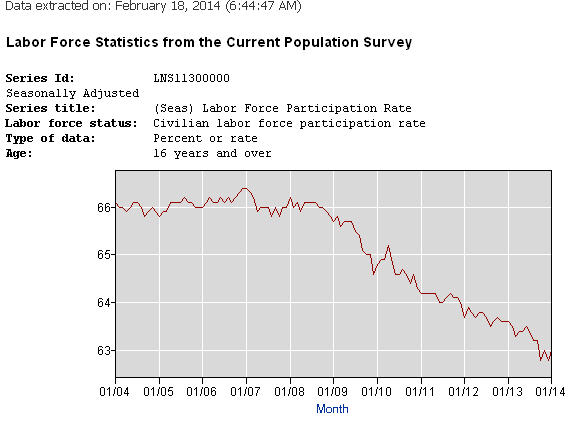
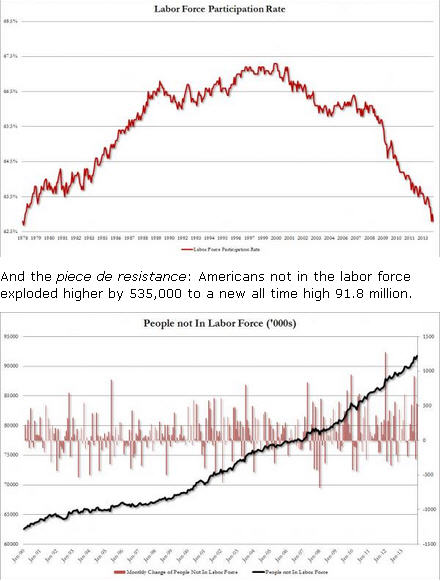
The participation rate reached a record high of 67.3 percent in early 2000; the highest it’s been under Trump is 63.2 percent.

In December 2016, the labor force participation rate was 62.7. It has moved between 62.7 and 63.1 since President Trump took office.

I love the fact that during a Republican administration, the estimates of jobs created is always low and economists are always surprised when the real numbers come out.

The article concludes:

And wages continue rising: In June, average hourly earnings for all employees on private nonfarm payrolls rose by 6 cents to $27.90, following a 9-cent gain in May. Over the past 12 months, average hourly earnings have increased by 3.1 percent.

Federal Reserve Chairman Jerome Powell, in a June 25 speech, said the economy has performed “reasonably well” so far this year, with continued growth and strong job creation keeping the unemployment rate near historic lows.

But Powell also mentioned “some ongoing cross-currents,” including trade uncertainty and incoming data about the strength of the global economy.

He said the Fed “will closely monitor the implications of incoming information for the economic outlook and will act as appropriate to sustain the expansion…” That could mean lower interest rates — or not, if the employment and job numbers remain strong.

Economic policies impact the economy. It matters who is occupying the White House. President Trump has proved that.

This Is How You Actually Help Middle-Class Families

On Friday, Investor’s Business Daily posted an editorial with the title, “Trump Delivers For Workers … After Years Of Empty Obama Promises.” The editorial cites the latest jobs report and explains how that excellent report is the result of President Trump’s economic policies. The first thing to remember here is that President Trump is a businessman–not a politician (although he has a very fast learning curve). His approach to government seems to be very similar to that of a businessman–what is the most efficient way to solve a problem? There are those in Washington who do not welcome this approach.

The editorial reminds us:

The 304,000 gain in jobs reported by the Labor Department was nearly twice the consensus estimate. And it comes after December’s expectation-busting gains.

There’s more. The jobs picture is so strong right now that it’s pulling people in who’ve been sitting on the sidelines.

In fact, for the first time in more than 20 years, the number of people who are out of the labor force — those without jobs and not looking — shrank by 647,000 over the past 12 months. So many people are returning to the labor force that the official unemployment rate is going up, even as the job market booms.

This comes, mind you, at a time when baby boomers are retiring en masse. Under Obama, in contrast, the number of labor force dropouts exploded by 14.4 million.

The latest numbers also underscore a point we’ve been making in this space for months — that all the talk of a tight labor market overlooked the vast pool of idle workers during the Obama years.

The editorial concludes:

Other evidence of this turnaround came earlier in the week, when the Labor Dept reported that private sector wages and salaries climbed 3% last year — the biggest annual increase in a decade. Under Obama, private sector wage gains averaged just 2%.

Why Now?

So why now, this late in the game?

The answer is simple. At least to those not blinded by partisanship or economic ideology.

For eight years, Obama kept promising “bottom-up growth,” while telling the country that tax cuts and deregulation would only benefit the rich. But his policies — Dodd-Frank, ObamaCare, higher taxes, a regulatory tsunami — produced economic stagnation. As it always does, that stagnation hurt the working class most.

Trump went in the opposite direction. His pro-growth tax cuts, deregulatory campaign and pro-energy policies fueled huge increases in economic optimism and turbocharged the economy. And now we’re seeing real job growth and strong wage gains for the first time in more than a decade.

You tell us which approach is proving more worker friendly.

Wouldn’t it be nice if Republicans and Democrats could work together to insure the continuation of this economic growth?

How Does This Statement Make Sense?

Yesterday I posted an article that included the following:

…Newly-elected Rep. Rashida Tlaib (D-MI) also endorsed impeaching Trump on her first day in office, according to The Nation, which described Tlaib as calling for “immediate steps” to remove the president from the White House.

“Each passing day brings more pain for the people most directly hurt by this president, and these are days we simply cannot get back. The time for impeachment proceedings is now,” Rep. Tlaib declared.

I really am confused about how this president is hurting people. I am further confused by looking at Representative Tlaib’s statement in view of some economic news that was reported today.

For instance, CNN is reporting today:

US employers added 312,000 jobs in December, well above what economists expected and underlining that the American economy remains strong despite recent market turbulence.

The unemployment rate rose to 3.9% as more people were looking for work. It had been at a 50-year low of 3.7% for two of the last three months.

Employers added 2.6 million jobs in 2018, compared to 2.2 million in 2017. Revisions to the October and November estimates added an additional 58,000 jobs to the 2018 total.

…Paychecks grew as employers raised wages to attract new workers. Average hourly pay was up 3.2% compared to a year earlier. The average number of hours people worked also edged up.

…The unemployment rate rose because more than 400,000 people joined the labor force looking for jobs. The percentage of the working-age people in the work force matched a five-year high.

“Yes, the nation’s unemployment rate rose to 3.9%, but for the best of reasons,” said Mark Hamrick, Bankrate.com senior economic analyst. “That’s a deal we’ll take if more people are participating in the workforce.”

The chart that I watch to see how things are going is from the Bureau of Labor Statistics. It is the chart of the Workforce Participation Rate. It indicates how many Americans are actually part of the workforce. This is the chart:

Note that we have reached the 63.1 percent participation rate only three times since 2014. When President Obama took office, the rate was 66.2. By the time President Obama left office, the rate was 62.7. That was after the federal deficit doubled due to the stimulus package that was supposed to create jobs.

The House of Representatives has a choice–they can either join in the efforts of President Trump to improve the American economy and the lives of American workers, or they can do everything they can to slow it down. Unfortunately, the new rules they are putting in place will bring us laws and policies that will slow the economy down. That is unfortunate–Americans deserve better, even though they elected these people.

The Numbers Are Good, But They Need To Be Better

The American economy is slowly improving. It is not racing along, but it is improving. Investor’s Business Daily recently posted an editorial explaining that although we have a 4.1 percent unemployment rate, we are not yet at full employment. As the article explains, there are other numbers that need to be considered when looking at the economy.

The editorial reports:

But look at the numbers more closely and you see that we are far from full employment.

First, the 0.1 percentage point decline in the unemployment rate in October was almost entirely the result of the fact that 968,000 dropped out of the labor force that month.

That’s right, for every new job created, nearly four people left the labor force.

The broader measure of unemployed — which combines those actively searching for a job with those working part time but want to work full time or are “marginally attached” to the labor force — show the jobless rate to be 7.9%.

And the IBD-TIPP poll shows that there’s likely even more slack than that. The October survey — which asks those polled whether they or anyone in their household is looking for work — shows that the share of job seekers is currently above 10%. This number, by the way, has consistently tracked higher than either of the BLS’s two measures.

Here’s another way to look at it. Back in December 2000, the unemployment rate was 3.9%. But that month, the labor force participation rate — the share of the population that’s either working or looking for a job — was 67%.

The current rate: 62.7%.

If the labor force participation rate were the same today as it was in 2000, the official unemployment rate would be more like 10%.

The 10% unemployment rate would be better than what the actual rate has been in recent years, but obviously, it is not good.

The editorial concludes:

There is clearly still a need for pro-growth policies to get millions of workers sitting on the sidelines back to work.

Those pro-growth policies need to begin with the passage of President Trump’s tax proposal followed by a complete repeal of ObamaCare. If the Republicans in Congress want to be re-elected, they need to do both. It is time to put away the fear of a political outsider succeeding as President and begin to work together to move the country forward.

An article on

An article on the website of the JFK Library includes the following paragraph:

The president finally decided that only a bold domestic program, including tax cuts, would restore his political momentum. Declaring that the absence of recession is not tantamount to economic growth, the president proposed in 1963 to cut income taxes from a range of 20-91% to 14-65% He also proposed a cut in the corporate tax rate from 52% to 47%. Ironically, economic growth expanded in 1963, and Republicans and conservative Democrats in Congress insisted that reducing taxes without corresponding spending cuts was unacceptable. Kennedy disagreed, arguing that “a rising tide lifts all boats” and that strong economic growth would not continue without lower taxes.

I wonder if John Kennedy would be welcome in today’s Democratic party.


How To Lie With Statistics

Ever wonder where the unemployment numbers come from? Ever wonder why you don’t seem to be moving forward and Washington is telling you how great the economic recovery is? Every wonder why you know a lot of Americans who have been unemployed for a long time and have given up searching for a job when the government keeps telling you that thousands of new jobs are being created every month? Ever wonder why your reality does not seem to agree with the reality you see reported on the news? Well, the world most of us live in is a little different from the world that the people writing the news, reporting the news, and working for the government live in.

This article doesn’t need words–it just needs charts and graphs.

From CNS News, the real unemployment picture:

BLMJobStatisticsThese are the real unemployment numbers–not the ones the Obama Administration is releasing–these numbers take into account the workforce participation rate.

This is the workforce participation rate taken from the Bureau of Labor Statistics:

WorkforceParticipationRateSo why are those in Washington painting such a rosy picture of the economy? They are doing great. Here is a list of the wealthiest counties in America from Wikipedia. The list is from 2012, but I seriously doubt much has changed. Note where they are located:

wealthiestcountiesinAmericaOur representatives no longer represent us. Nor are the bureaucrats in government serving the American people. It is long past time to clean house!


Looking Past The Obvious

President Obama has touted the ‘economic recovery‘ as one of his accomplishments. He might want to be a little quieter about that as the latest jobs figures and the numbers behind them indicate a very slow recovery.

Yesterday Investor’s Business Daily posted an article about the jobs numbers just released.

Some highlights from the article:

While last month’s overall gain of 38,000 jobs, including a 25,000 rise in private payrolls, was dragged down temporarily by the labor strike of 35,000 Verizon (VZ) communications workers, the weakness was broad-based. On net, just 51.3% of industries added jobs, the lowest since February 2010, Labor Department data showed.

…One decent bit of news in the employment report is that the trend of firming wages remained intact, as hourly pay rose 0.2% from April and 2.5% from a year ago. That’s consistent with anecdotal reports of companies having to pay more to attract or keep good workers, and many finding qualified workers in short supply.

…The drop in the unemployment rate to 4.7% from 5% in April appears at first to be consistent with a tight labor market. Still, the sudden drop in joblessness, which reflected fewer people in the workforce rather than an increase in employment, should be taken with a grain of salt, given the household survey’s higher margin of error.

…The reality portrayed by the weak jobs report got some confirmation from the Institute for Supply Management’s survey of non-manufacturing industries, with the index slipping to a 28-month low of 52.9 in May from 55.7 in April — well below expectations. The employment gauge fell into negative territory, dropping 3.3 points to 49.7, just below the neutral 50 level.

…Somehow, the retail sector has seemingly defied gravity when it comes to employment, adding 11,400 jobs last month and 323,000 over the past year. The explanation may be that the workweek has shrunk, since aggregate hours of work in the retail industry are down 0.3% over the past three months.

So what is the bottom line? Workforce participation is down, job growth is slow, and the number of hours people are working has gone down. That doesn’t sound like a robust economic recovery to me. It is definitely time for a change of direction. As I have previously stated, I am not a Trump supporter, but I will vote for him because I believe that he may have the business experience to turn this mess around.

How Many Americans Are Actually Working?

We don’t hear a lot about the Labor Force Participation Rate, but it is an important part of the American economy. It is an indication of how many Americans are actually working. The current unemployment rate is somewhere around 5 percent, but without looking at the Labor Force Participation Rate, that number really does not mean much. The 5 percent does not include those people who have given up looking for a job, that is why the Labor Participation Rate is important.

The Bureau of Labor Statistics website includes these two charts that give a clearer picture of the American economy:

LaborForceParticipationLaborForceParticipation2As you can see, we have been losing ground since 2007. It is time to shrink government, limit government regulations, and allow Americans to prosper. Consider this as you decide how to vote in the upcoming election in November. Hillary Clinton would be the third term of President Obama. If we want the above numbers to change, we need to vote for someone who will change our economic direction.

Creating More Unemployment In America

Investor’s Business Daily posted a story today about an executive order issued by President Obama.

The article reports:

This time, the president isn’t seeking to flood the country with tens of thousands of indigent, border-surging migrants in search of bigger benefits packages.

Instead, he plans to award via executive order work permits to 100,000 foreign college grads (including deportable aliens) to compete with U.S. workers for jobs.

Cui bono? Certainly not the U.S. workers he purports to champion.

Obama’s Homeland Security rule, published in the Federal Register on Thursday, amounts to yet another illegal power grab by explicitly treading on Congress‘ constitutional prerogative to set immigration quotas.

It also comes at a time when 94 million U.S. workers have been unemployed so long they’re no longer counted in labor-participation statistics. Some New Year’s Day present for millions of discouraged Americans.

The move is especially nefarious not just because it stands as another example of executive overreach but also because foreign workers already have U.S. workers at a disadvantage.

For one thing, they’re able to work cheaper. Unlike Americans, most have had free tuition rides from their sponsoring countries and carry no student loan debt. This enables them to tolerate lower wages than American grads saddled with high loan costs that can’t be shirked even in bankruptcy court.

The foreign workers are also exempt from Obamacare rules that add to the employer cost of hiring workers. While liberal politicians complain about sending jobs oversees, they seem to have no problem bringing foreign workers here to take American jobs. It is time Congress put an end to these endless executive orders. It is time for Congress to develop a spine.

The July Employment Numbers

This is the chart from the Bureau of Labor Statistics:

BureauofLaborStatisticsJuly2015

So what does this mean? Breitbart.com posted a story about the numbers today.

The article reports:

July’s labor force participation rate however remained the the same as June at 62.6 percent. Before last month the labor force participation rate had not been that low since October 1977, when the participation rate was 62.4 percent.

The BLS reports that the civilian labor force did experience a slight uptick from 157,037,000 in June to 157,106,000 in July after the month of June saw it drop by 432,000.

While the labor participation rate remains at the lowest its been since the late 1970s, the BLS highlighted that the unemployment rate remained at 5.3 percent and nonfarm payroll jobs increased by 215,000.

The labor participation rate is a concern. The unemployment rate does not take the labor participation rate into consideration–it is based only on the number of people actually looking for work that are unemployed. The current labor participation rate is not indicative of a healthy economy.


Looking Past The Obvious

Breitbart.com posted an article today about the June jobs report. Most of the mainstream media is trumpeting the fact that 237,000 jobs were created in June. That is good, but what they fail to mention is that the civilian labor force shrank by 432,000.

The article reports:

The labor force participation rate also decreased 0.3 percent from last month to 62.6 percent.

The country has not seen a labor force participation rate that low since October 1977 when the participation rate was 62.4 percent.

The BLS reports that the civilian labor force also shrank by 432,000 in June, from 157,469,000 in May to 157,037,000 in June.

While people dropped out of the workforce the BLS (Bureau of Labor Statistics) highlighted that the unemployment rate declined to 5.3 percent and payroll jobs increased by 223,000.

The number of people who dropped out of the labor force was higher than the number of jobs created. That is not a good thing.

The Obama Administration’s Economic Policies Are Not Working

Zero Hedge posted a story today on the latest jobs numbers.

The article included the following charts:

https://www.rightwinggranny.com/wp-content/uploads/2015/05/not-in-labor-force.jpg

The article reports:

In what was an “unambiguously” unpleasant April jobs payrolls report, with a March revision dragging that month’s job gain to the lowest level since June of 2012, the fact that the number of Americans not in the labor force rose once again, this time to 93,194K from 93,175K, with the result being a participation rate of 69.45 or just above the lowest percentage since 1977, will merely catalyze even more upside to the so called “market” which continues to reflect nothing but central bank liquidity, and thus – the accelerating deterioration of the broader economy.

Our economy is not doing well. It is time for a change of policy.

The Jobs Report In Wisconsin

Right now, Scott Walker is the top Republican fund raiser in the Presidential primary. He is also a favorite of the conservatives, which makes him a prime target of attack for the Clinton machine and anyone out there on the liberal side of the spectrum that has designs on the presidency. Get ready for the attacks–here are some of the facts.

Today’s Wall Street Journal posted an article about his record on employment in Wisconsin. Scott Walker took office in 2011. He faced a recall almost immediately, which he won. Despite the opposition, he continued his policies of cutting spending and lowering taxes.

The article reports the results:

Yet Wisconsin’s employment-population ratio has jumped 2.5%—significantly more than the national improvement rate. Wisconsin is also gaining ground against other states. In February 2011 Wisconsin ranked 12th in employment-population ratio. It now ranks ninth.

The U.S. employment-population ratio has grown 1.5% since Mr. Walker took charge.

The article further explains:

Some will rightly point out that the unemployment rate fails to account for people who can’t find a job and stop searching. And so a low unemployment rate is more meaningful if it is accompanied by high participation in the labor force. Since February 2011, the national labor-force participation rate has dropped to 62.7%, from 64.2%. Wisconsin’s rate, much healthier than the national average, has also declined but by significantly less, to 68.4% from 69.1%.

Wisconsin’s current 68.4% labor-force participation rate is particularly noteworthy because it represents an uptick over the past year from a low of 68.1%. Nationally, the average labor-force participation rate has declined to lows last seen during the Carter administration.

Given that Wisconsin’s unemployment has dropped to 4.6% from 5.6% in the past year, the state is in the enviable position of having lowered unemployment while increasing labor-force participation. Not surprisingly, this has helped Wisconsin move up to eighth place in state labor-force participation, from 12th in 2011.

Keep these figures in mind as you hear the attacks on Scott Walker that will be coming from the political left. I have not yet made up my mind as to whom I am supporting in the Republican presidential primary, but these are impressive statistics.

Lying With Statistics

Yesterday The Federalist posted an article about the latest unemployment numbers from the Department of Labor. There was rejoicing that the unemployment rate had dropped to 5.5 percent. You might want to hold off on that rejoicing for a bit.

The article includes a chart showing what the unemployment number actually is when you add in the labor force dropouts:

Unemployment Rate With Labor Force Dropouts March 2015

As you can see, the actual unemployment rate is closer to 10 percent. So, if you know anyone who is unemployed and can’t understand why it is so hard to find a job, show them the real numbers. It might make them feel better.

The article explains:

This decline (the decline in the labor force participation rate) has significant effects on the official unemployment rate. People who are unemployed and eventually stop looking for work are no longer counted as being part of the labor force, which means they’re no longer counted by U.S. statistical agencies as being unemployed (you can read in detail about the math underlying this dynamic here). The result? An artificially low official unemployment rate.

It is an unfortunate fact of life that you can make statistics say pretty much anything you want them to say.

Who Is Working And Who Is Not

The National Review Online posted an article today about job growth since the recession began in December 2007.

The article reports:

From November 2007 through November 2014, the number of employed native-born Americans has decreased more than 1.45 million, while the number of employed immigrants has risen by more than 2 million (as the immigrant population grew rapidly, too), according to data compiled by the Department of Labor’s Bureau of Labor Statistics.

“Native employment has still not returned to pre-recession levels, while immigrant employment already exceeds pre-recession levels,” the report says. “Furthermore, even with recent job growth, the number of natives not in the labor force (neither working nor looking for work) continues to increase.”

This might be something to consider when debating President Obama’s amnesty memo. I suspect there are two main reasons for this statistic–first of all immigrants (legal or illegal) may be willing to work for lower wages, and secondly, many immigrants may have a stronger work ethic than many Americans. Either way, this does not bode well for America’s future.


Looking Behind The Obvious Numbers

The jobs report came out today. John Hinderaker at Power Line posted an article about the numbers reminding us that what we read in the media may not be the whole story.

Some of the facts he points out:

* The number of people aged 16 years and above who are not in the labor force increased by 111,000 this past month. While a somewhat lower increase than in months past, it still outpaces forecasted retirements.

* The number of people taking part-time jobs because they cannot find full-time work increased by 275,000 this past month.

* In fact, the number of people employed full-time (according to the household survey that also counts self-employed) declined by 523,000 while the number of part-time workers increased by 799,000 (which includes those who wanted part-time and those who wanted full-time but could only find part-time). These estimates are seasonally adjusted to account for the normal increase in June part-time work.

* The U-6 unemployment rate (the broadest measure of unemployment) remains virtually unchanged at 12.1 percent. U-6 includes those people who are discouraged, only occasionally trying to find work, and those employed part-time for economic reasons.

The article also reminds us that both incomes and economic growth remain flat. It seems as if the only thing growing in this economy is the Stock Market (which the government is currently propping up).

The Real Unemployment Story Under President Obama

This is a chart of the labor participation rate since 2004:

The chart is from an article posted Friday at Doug Ross @ Journal. As you can see from the chart, the rate was a pretty solid 66 percent for the years 2004 through 2008. It began to drop in 2009 and has continued downward. The current low unemployment rate was obtained by not counting the people who have dropped out of the labor force.  As you can see, there have been a lot of them since 2009. The bottom line here is simple–the economy is not recovering at this time. It is limping along and will be further limited by the President’s war on coal and other environmental decisions.

Enhanced by Zemanta

About Those Unemployment Numbers

John Crudele at the New York Post has done a number of stories about fraud in the reporting of the unemployment numbers. He posted a story yesterday about the Congressional investigations into this fraud, including an investigation by the House Oversight Committee and Congress’ Joint Economic Committee. He adds that he is also investigating. He is currently waiting for the Commerce Department to comply with a Freedom of Information Act request he has filed for e-mails and text messages between people in the Philadelphia Census office.

The article reports:

At the core of all these investigations is solid evidence that at least one surveyor — a guy named Julius Buckmon, working out of the Philadelphia Census office but polling in Washington, DC — submitted fake household surveys that were used in compiling the Labor Department’s unemployment rate.

Because of the scientific nature of the Labor Department survey, Buckmon’s actions alone would have affected the responses of some 500,000 households.

But as I’ve been reporting, the scam was allegedly much larger than that and included other surveyors (or enumerators as they are called) over many years. And supervisors at least two levels up are said to have known about — and covered up — the scandal.

What the investigators are looking for is that the unemployment numbers were falsified so that they would drop just before the 2012 election. In fact, the unemployment rate did drop before the election.

This is a chart from trading economics.com:

United States Unemployment Rate

Before you get too excited over the fact that unemployment may be dropping, you need to take a look at the labor force participation rate. When people stop looking for jobs, they are no longer counted as unemployed. Therefore, as the number of people who are working drops, the unemployment rate drops. That is not the way it should be, but it is the way it is. The chart below from the Bureau of Labor Statistics shows what has happened to our labor force participation rate since 2009:

laborparticipationrate2014Regardless of whether or not there is fraud involved, our current unemployment numbers are very misleading. Please follow the link above to the New York Post to hear the rest of the story. There is a smoking gun. Unfortunately, the person in charge at the time is claiming that he never saw it.

Enhanced by Zemanta

Today’s Economic Numbers

Investors.com posted an article today analyzing the jobs report that was released today. It is a mixed picture.

In chart form:

The chart shows a decreasing official unemployment rate, but it also shows what the unemployment rate would be if the labor participation rate used to calculate the unemployment rate were constant. The number of people who are not currently in the labor force is extremely high.

The article reports:

To further muddle the picture, January’s employment report showed a gain of 21,000 manufacturing jobs. Construction added 48,000 workers, the most since the recession, after a sharp weather-related drop in December. Meanwhile, retailers shed 12,900 jobs and cut the average workweek to 29.7 hours.

“We shouldn’t be surprised that the job gains are not at the level that they were in October and November,” said Keith Hembre, chief economist with Nuveen Asset Management. “But I am surprised we didn’t get more of a bounceback.”

Other unexpectedly weak data in the past few weeks include sharp drops in durable goods orders as well as new- and pending home sales.

Federal Reserve policymakers noted the housing pause at their January meeting, but decided other improvements in the economy were enough to justify continuing to taper asset purchases.

Hembre said the latest data shouldn’t change that outlook.

At some point the Federal Reserve policymakers are going to have to taper their asset purchases. The longer they postpone that, the more of a shock it is going to be. Unfortunately, the Federal Reserve has propped up the dollar and the stock market to the point where there will not be a soft landing. Because of the financial policies of the Federal Reserve for the past ten or twelve years, we will probably experience a very bumpy landing some time in the next six months. I believe we will come through it, but I also believe it will be very bumpy.

Enhanced by Zemanta

The Numbers Behind The Numbers

The two charts below are from a website called zerohedge.com. They were posted today. The article posted the charts to explain how the unemployment rate has gone from 7.0% to 6.7%. The unemployment situation for Americans have not improved–more Americans have given up and stopped looking for jobs. We are not in an economic recovery.

LaborForceParticipationRate


Enhanced by Zemanta

About Those Jobs Numbers

John Crudele at the New York Post has posted a few articles raising questions about how the Obama Administration is calculating unemployment numbers. He posted one yesterday. Mr. Crudele has pointed out that unemployment numbers are coming from the Census Bureau and that in 2010 one of its enumerators was caught fabricating interviews.

The article reports:

The Census Department surveys that went into the November jobless rate actually took place during the week that included Nov. 5 instead of the normal Nov. 12 week.

The Labor Department did put in a note about the survey week change in its November report.

But it should also have included another line that said: “The data for the unemployment rate may have been compromised. Lots of people are looking into the matter right now. We’ll get back to you on whether you should believe these numbers or not.”

John Hinderaker posted a story about the jobs numbers at Power Line today.

The article at Power Line includes the following chart:

120613-600x375

The chart shows what has happened to the labor participation rate since 2008–it dropped like a rock and stayed there.

The article at Power Line quotes James Pethokoukis of the American Enterprise Institute:

    1. There are still 1.1 million fewer employed Americans today than right before the recession started, despite a potential labor force that’s 14 million larger. And there are 3.6 million fewer full-time workers than back in 2007.

    2. The employment rate, the share of Americans with a job, is 58.6% — exactly where it was in November 2009.

    3. If the labor force participation rate were where it was a year ago, the jobless rate would be 7.9%, not 7% (and 11.3% if the LFPR were at prerecession levels, though closer to 9% if demographics-adjusted).

The article at Power Line concludes:

Back in the heady days of 2008 and 2009, the Democrats were universally confident that the economy would improve dramatically, as it always does after a recession, regardless of the policies the Democrats followed. All they would need to do was take credit when the time came. The bitter lesson of the last five years is that federal policies do matter. The American economy is diverse and resilient, but if our government’s policies are stupid enough, they can blight the prospects of an entire generation.

If you were planning to break out the champagne because of the 7 per cent unemployment rate, you might want to hold off for a little bit. If you want to turn this around, think before you vote.


Enhanced by Zemanta

Changing The Numbers To Fit The Situation

Remember when 5 percent unemployment under George W. Bush meant that we were in horrible economic straits? Remember when gas prices hit $3.00 a gallon under George W. Bush and it was the end of the American economy as we knew it? Anyone else long for those days?

We are being told that the unemployment rate is currently hovering around 7 percent. We are also watching the labor participation rate fall to 62.8 percent (Investor’s Business Daily). This puts the true unemployment rate at about 11.8 percent.

Investor’s Business Daily reports:

When the economy fell into recession in December 2007, the jobless rate was 5% and the labor force participation rate was 66%. As job losses surged, unemployment doubled to 10% in October 2009, a few months after the recession officially ended. The jobless rate slowly began to edge down, but held at 9% or above for nearly two years, and above 8% for nearly three years.

But the drop largely reflected job market weakness rather than strength. During this time, labor force participation steadily fell. In October 2009, when official unemployment peaked, participation was 65%. A year later it was 64.4%. Now, more than four years into the expansion, it’s 62.8%, the lowest in 35 years.

But wait–there’s more. The New York Post reported yesterday that Congress will begin an investigation on how unemployment numbers have been calculated and released particularly during the run-up to the 2012 election.

The article at the New York Post reports:

Last week I reported exclusively that someone at the Census Bureau’s Philadelphia region had been screwing around with employment data. And that person, after he was caught in 2010, claimed he was told to do so by a supervisor two levels up the chain of command.

On top of that, a reliable source whom I haven’t identified said the falsification of employment data by Census was widespread and ongoing, especially around the time of the 2012 election.

In 2009, before the 2010 census was taken, the White House changed the rules on how the census would be reported. The Census Bureau would report to senior White House aides. I will admit that at the time I thought this would result in some population statistics being altered to increase the number of votes in blue states and decrease the number of votes in red states. It didn’t occur to me at the time that these numbers could also be used to skew unemployment data.

The New York Post continues:

Back in 2010, I started getting reports that the Census Bureau had some very unusual hiring practices. Census takers and supervisors — at risk of heavy fines — were reporting to me that large numbers of people were being hired only to be fired shortly afterward. And then rehired.

I theorized at the time that Census was trying to make the job-creation totals look better nationwide in those bleak months leading up to the midterm congressional elections.

This employment policy seemed too coordinated. The regional higher-ups at Census couldn’t be doing this on their own; there had to be a grander plan.

I still don’t know what was going on.

But then I heard about the falsification in Philly. This time, however, it wasn’t the employment numbers that were being doodled with. This time it was the unemployment data, which are gathered at the Census Bureau and handed over raw to the Labor Department.

Please follow the link and read the entire story. Unfortunately most of the media is unaware of this or ignoring it. As voters, all of us need to be aware of what is taking place here.

Enhanced by Zemanta

It’s Not The Unemployment Numbers–It’s The Number Of People Who Have Dropped Out Of The Labor Force

Today’s Daily Caller reported that the percentage of Americans in the labor force has reached a record low–62.8 percent. According to the article, a record high 91,541,000 Americans did not participate in the labor force this October. Since January 2009, more than 11 million people have dropped out of the labor force.
The article concludes:

The economic blog Zero Hedge notes that at the current rate, the number of people not participating in the labor force could exceed those working in about four years.

This is unlike any economic recovery from a recession we have ever had.

Some Pictures From The Latest Jobs Report

On August 29, Breitbart.com posted a story about the current labor force participation rate. The chart below tells the story:

Although the unemployment numbers look good, they don’t tell the whole story:

The labor force participation rate is the lowest it has been in 34 years.

The article at Breitbart contains this rather chilling quote:

“Following the Great Recession, we’ve entered into the Great Shift,” says Express Employment Professionals CEO Bob Funk, who previously served as chairman of the Kansas City Federal Reserve Bank. “This is a period defined by the Boomer retirement, Millennial frustration, and growing reliance on government programs. All indicators suggest this shift is not sustainable.” (emphasis mine)

The economic policies of the Obama Administration have not worked. If President Obama will not reverse them, we need to elect people who will. Our future depends on it.

Enhanced by Zemanta

Underneath The Jobs Numbers

Yahoo Finance posted an article today that included the Labor Force Participation Rate in the latest jobs numbers.

According to the article:

The civilian labor force decreased by 37,000 to 155.80 million in July, while those not in the labor force rose by 240,000 to 89.96 million.

The decrease in the percentage of Americans in the labor force–63.4% last month from 63.5% the month before–is one of the main reasons for the drop in the unemployment rate–to 7.4% in July from 7.6% in June.

Many of the jobs added were part time jobs and many jobs changed from full time to part time. ObamaCare has created some serious problems for the American economy (ObamaCare is responsible for the growth of part time jobs) and will continue to do so until it is defunded and stopped. I am not sure if the Republicans in the House of Representatives are going to get anywhere with their attempts at defunding it, but I give them credit for trying.

Enhanced by Zemanta

The Numbers Behind The Jobs Report

Investors Business Daily posted an article today on the latest jobs numbers.

The article reports:

Although somewhat better than expected, the 175,000 net jobs created in May continues the historically tepid jobs growth trend that has come to characterize the now four-year-old economic recovery.

The result has been continued high unemployment, a vast pool of long-term jobless, and an unprecedented number of people who’ve dropped out of the labor force.

The article reminds us that there are 2.4 million fewer people working than there were in January 2008. The Democrats have attempted to blame the slow job growth on sequestration, but that doesn’t make sense. Sequestration did not go into effect until March, and sequestration cut the rate of growth–it did not cut the budget.

The article also points out:

…the total number of government jobs climbed more than 7,000 since January (not including U.S. Postal Service jobs, which get included in government statistics even though the USPS is independently run).

It really is time to shrink the government. It is ridiculous that as the number of people leaving the workforce increase, the government continues to grow.
Enhanced by Zemanta