The Numbers That Are Not Being Shared By The Mainstream Media

On Thursday, Fox Business posted the following headline:

Layoffs surged 136% in January to second-highest level on record

The article reports:

The pace of job cuts by U.S. employers accelerated at the start of 2024, a sign the labor market is starting to deteriorate in the face of ongoing inflation and high interest rates.

That is according to a new report published by Challenger, Gray & Christmas, which found that companies planned 82,307 job cuts in January, a substantial 136% increase from the previous month. However, that is down about 20% from the same time one year ago. It marked the second-highest layoff total for the month of January in data going back to 2009.

“Waves of layoff announcements hit U.S.-based companies in January after a quiet fourth quarter,” said Andy Challenger, senior vice president of Challenger, Gray & Christmas. The cuts were “driven by broader economic trends and a strategic shift towards increased automation and AI adoption in various sectors, though in most cases, companies point to cost-cutting as the main driver for layoffs.”

According to the Bureau of Labor Statistics, the workforce participation rate has remained steady since December at 62.5, down from 62.8 in November. Generally hiring is up in November due to Christmas shoppers.

The article concludes:

Another source of layoffs in January was retail stores, which trimmed 5,364 positions in January, a significant increase from the 110 layoffs announced in December. 

The top reason cited for job cuts last month was restructuring; companies blamed stores closing and artificial intelligence for the layoffs, as well.

The labor market has remained historically tight over the past year, defying economists’ expectations for a slowdown. Although economists say it is beginning to normalize after last year’s blistering pace, it is nowhere near breaking. 

The findings precede the release of the more closely watched January jobs report from the Labor Department on Friday morning, which is expected to show that employers hired 180,000 workers, following a gain of 216,000 in December

The unemployment rate is expected to inch higher to 3.8%.

As more people are laid off, there will be less demand for consumer goods. This theoretically will slow inflation, but at the cost of the American people. If the government truly wanted to slow inflation without hurting the average American, they would cut government spending, but that is not likely to happen.

What Has Happened To Many Unaccompanied Minors Crossing The Border

On Wednesday, The Washington Free Beacon posted an article about an investigation by the Labor Department’s Office of Inspector General into violations of child labor laws involving unaccompanied minor children who have crossed the southern border into America.

The article reports:

It’s the latest development in a scandal involving the Labor Department, the Department of Health and Human Services, and the White House.

The New York Times first broke the story in April, when it showed documents proving the administration was quickly releasing unaccompanied migrant children into the country by the thousands. Many of those children ended up working grueling jobs, often for long hours and in dangerous conditions where they worked with chemicals and industrial equipment.

The probe comes amid rising cases of illegal child labor, Bloomberg reported:

Agency officials said in July that over the past 10 months alone, the DOL’s wage division has concluded 765 cases involving 4,474 children employed in violation of federal child labor laws. Overall, the department reported that it’s seen a 69% increase child labor violations from 2018 and 2022.

Sen. Josh Hawley (R., Mo.) slammed the Biden administration in June for its failure to address the widespread crisis.

“This administration has let tens of thousands of children be sold into slavery,” Hawley said. “They are doing nothing about it.”

How many times have you heard Democrats say that they were doing something ‘for the children”? Closing the southern border would be one thing that would definitely protect many children.

The article notes:

Five former HHS employees said they were pushed out of the agency after they raised concerns about children’s safety.

The Times report also implicated former domestic policy adviser Susan Rice. Rice and her team reportedly failed to act, even as administration staffers called for stricter vetting of the sponsors migrant children were placed with to prevent human trafficking. A week after the Times report, the White House announced that Rice would step down.

Has anyone in the mainstream media reported this?

The Truth About The Jobs Report

Robert DuChemin is a writer at substack. He is a Florida attorney who does great research and is very adept at analyzing information. Recently he posted an article that included some good perspective on the recent jobs report.

The article notes:

…Today’s Labor Department press release claims once again to have “created” more than 360,000 new jobs. I read the entire release and nowhere in the release did they mention the total number of people employed in the USA last month.

It is not like they don’t have those numbers. After a little digging, I discovered from the Labor Department’s own files that 160,721,000 Americans were employed last month. In April, 161,031,000 Americans were employed (shockingly, they adjusted this number after last month‘s release). There is no way anybody using regular math can claim that a loss of about 700,000 jobs was an increase of 360,000 jobs. No wonder they left the total numbers out of their press release.

But it is worse than that. Prior to the pandemic, in February 2020, there were 162,800,000 Americans gainfully employed.

So, with all of his claims of “creating” more jobs, in 2 1/2 years and a $5 trillion increase in debt, Joe still has not replaced all of the jobs lost to the Wuhan Flu disaster. He remains 2,000,000 jobs short.

It drives me crazy that nobody in the broadcast or cable news is discussing this outright lie. Does everybody think Americans are too stupid to read a basic spreadsheet?

Also horrible was the government adding more than 50,000 jobs last month while the number of private-sector jobs decreased. As any first year economics student could tell you, private sector jobs expand the free market economy, government jobs contract the free market economy.

Joe is also going to claim the Fiscal Responsibility Act of 2023 as a Democrat victory even though he has yet to read the actual bill passed by Congress. He gets the bill tomorrow. As I have previously explained, the fact that they won anything was a huge GOP victory because China Joe promised several times that he would “not negotiate,” “not budge one inch,” not give in to people who want to make America great again. The GOP, only 4 people shy of having zero control of any part of our government, was able to negotiate substantial reductions and recover previously allocated money for the first time in US history. There is no way this was a Democrat victory.

Joe’s plans to destroy this country are on life-support, and the GOP can easily pull the plug during this year’s appropriations.

A good statistician can make numbers say anything he wants them to say. It seems as if the only people in the Biden administration who are actually good at their jobs are the ones that know how to lie with statistics.

Keeping Americans’ Wages Low

In September 2022, the Workforce Participation Rate was 62.3, slightly down from 62.4 in August. Part of that is due to the end of summer jobs, but even at that, the number is not where it needs to be. In February 2020 (before the pandemic), it was 63.4. That is the highest number since June 2013. Our economy is struggling right now, and Americans are struggling under the burden of inflation.

On Thursday, Breitbart reported the following:

President Joe Biden is set to import nearly 65,000 H-2B foreign visa workers to take blue-collar American jobs as roughly 11.6 million Americans remain jobless.

This week, Biden’s Department of Homeland Security (DHS) and Labor Department announced that the administration would be allowing businesses to import a few less than 65,000 H-2B foreign visa workers to take nonagricultural jobs in construction, meatpacking, and landscaping, among other industries.

This is in addition to the 66,000 H-2B foreign visa workers that the Biden administration has already allowed into the United States labor market to take blue-collar jobs.

…The big business lobby is praising the inflation of the U.S. labor market as a victory but also suggested in a statement that they want more legal immigration overall so companies can rely on a steady stream of cheaper foreign workers as opposed to hiring unemployed Americans.

This is one example of the uni-party. Big business Republicans want cheap labor, and Democrats want new voters.

The article concludes:

When comparing the wages of H-2B foreign workers to the national wage average for each blue-collar industry, about 21 out of 25 of the industries offered lower wages to foreign workers than Americans.

Annually, the U.S. gives green cards to about 1.2 million legal immigrants, while another 1.4 million foreign workers are admitted every year to take American jobs. At the same time, hundreds of thousands of illegal aliens are added to the labor market every year, many on work permits given to them by the federal government.

Until we elect people who actually support American workers, this will continue.

Are You Better Off Now Than You Were A Year Ago?

In the past, many election campaigns have asked the question, “Are you better off now than you were four years ago?” We have seen the results of an election even after only one year.

The Wall Street Journal posted an article Thursday about the current rate of inflation.

The article reports:

A relentless surge in U.S. inflation reached another four-decade high last month, accelerating to a 7.5% annual rate as strong consumer demand collided with pandemic-related supply disruptions.

The Labor Department on Thursday said the consumer-price index—which measures what consumers pay for goods and services—in January reached its highest level since February 1982, when compared with the same month a year ago. That put inflation above December’s 7% annual rate and well above the 1.8% annual rate for inflation in 2019 ahead of the pandemic.

The so-called core price index, which excludes the often volatile categories of food and energy, climbed 6% in January from a year earlier. That was a sharper rise than December’s 5.5% increase and the highest rate in nearly 40 years.

Prices were up sharply in January for a number of everyday household items, including food, vehicles, shelter and electricity. A sharp uptick in housing rental prices—one of the biggest monthly costs for households—contributed to last month’s increase.

High inflation is the dark side of the unusually strong economy that has been powered in part by government stimulus to counter the pandemic’s impact. January’s continued acceleration increased the likelihood that Federal Reserve officials could speed up a series of interest-rate increases this spring to ease surging prices and cool the economy.

Inflation is a tax that impacts everyone. When your grocery bill doubles, you have to find a way to pay for the increase and still pay your other monthly bills. People who live paycheck to paycheck are being negatively impacted. The increased price of gasoline impacts the spending power of everyone who has to commute to work every day and the price of anything we buy that is transported by truck.

Elections have consequences.

Experts Amazed–Again

CNBC is reporting the following today:

Employment stunningly rose by 2.5 million in May and the jobless rate declined to 13.3%, according to data Friday from the Labor Department that was far better than economists had been expecting and indicated that an economic turnaround could be close at hand.

Economists surveyed by Dow Jones had been expecting payrolls to drop by 8.33 million and the unemployment rate to rise to 19.5% from April’s 14.7%. If Wall Street expectations had been accurate, it would have been the worst figure since the Great Depression.

As it turned out, May’s numbers showed the U.S. may well be on the road to recovery after its fastest plunge in history.

Experts are shocked. The mainstream media is disappointed. The Democrats are disheartened.

The workforce participation rate for May was 60.8. In April, it was 60.2. In March, it was 62.7, and in February it was 63.4. You can see the impact of the shutdown in that rate, and you can also see the hope for the future in that rate.

The current riots will not help anyone. However, oddly enough, where people choose to rebuild when the riots end, there will be jobs. Hopefully those jobs will go to the people in the neighborhood (who generally are not responsible for the rioting and looting). We will recover from the shutdown and the riots. Hopefully it will happen more quickly than the experts seem willing to believe.

The Economy Is Strong

No one really knows what impact the coronavirus will have on our economy, but as for now, the February jobs report showed a strong, vibrant, growing economy.

Yahoo News posted details of the report today.

The article reports:

The Labor Department released its February jobs report at 8:30 a.m. ET Friday. Here were the main results from the report, compared to consensus expectations compiled by Bloomberg:

  • Change in non-farm payrolls: +273,000 vs. +175,000 expected and 273,000 in January
  • Unemployment rate: 3.5% vs. 3.6% expected and 3.6% in January
  • Avg. hourly earnings, month on month: +0.3% vs. +0.3% expected and +0.2% in January
  • Avg. hourly earnings, year on year: 3.0% vs. +3.0% expected and 3.1% in January

January’s job gains were upwardly revised to 273,000, from the 225,000 previously reported, and December’s non-farm payroll additions were upwardly revised by 37,000 to 184,000. This brought average job gains over the past three months up to 243,000, or above the average from 2019, when job growth averaged 178,000 per month.

The services sector again led the advance in job gains in February. Within this sector, health-care and social assistance added 56,500 payrolls, accelerating gains from January. Professional and business services also posted strong job gains, adding a net 41,000 positions.

Within the services sector, wholesale trade, retail trade, transportation and warehousing and temporary health services shed jobs in February. Retail posted the largest declines, losing a net 7,000 positions and extending a drop of 5,800 from January.

For the goods-producing sector, manufacturing added jobs for the first time in three months, posting a net 15,000 payroll gains. Construction and mining each also added jobs, underscoring a firming of the goods-producing sector in February after months of weakness relative to services. Employment in construction rose by 42,000 positions for the month after a gain of 49,000 in January, representing the best two-month advance for the industry since March 2018, as unseasonably warm weather and a strengthening housing market helped supported hiring.

The Workforce Participation Rate remained steady at 63.4 percent.

It’s always interesting to me that when the jobs report comes out during a Republican administration, the numbers always seem to be higher than the experts predicted. There will be some impact in March from the coronavirus because of the disruption in the global supply chain the virus has caused, but I believe the economy is strong enough to recover from any glitches that may occur (despite the undisguised wishes of the Democrat party for a serious economic downturn).

The Trump Economy Continues To Thrive

Fox News posted an article today about the January jobs numbers.

The article reports:

U.S. hiring topped expectations in January, as the economy added 225,000 jobs, kicking off the decade on a stronger-than-expected note.

It marks the 112th month of straight gains.

Unemployment ticked up slightly to 3.6 percent, as more people were looking for work, the Labor Department said Friday. The labor force participation rate edged up slightly to 63.4 percent. Average hourly earnings, meanwhile, rose by 7 cents over the past year to $28.44.

“Taken together, the first report of 2020 is a healthy one — showing that a possible redux of the roaring twenties updated for the 21st Century isn’t off the table yet,” Daniel Zhao, Glassdoor senior economist, said.

The labor force participation rate has not been at 63.4 percent since June of 2013.

The article notes:

“The labor market is continuing at a solid pace, and unemployment remains low,” said CareerBuilder CEO Irina Novoselsky. “It’s a crowded market for those battling to attract top talent and businesses are seeing the most traction when touting company culture along with their open positions.”

As the U.S. continues the longest economic expansion on record, investors are looking at the Department of Labor’s monthly payroll and unemployment data for signs that the rapid job growth over the past two years is softening and leading way to an overall growth slowdown.

The report contained a bad omen for manufacturing, which has been in a year-long rut: In January, the sector lost 12,000 jobs, most of which stemmed from motor vehicles and parts.

More Americans are going back to work, and wages at all levels are increasing. That is good news for all Americans.

The Trump Economy

Newsmax posted an article today about the state of the American economy.

The article reports:

Companies in the U.S. ramped up hiring at the start of the year, taking on the most workers since May 2015 and indicating the labor market remains robust, a report on private payrolls showed Wednesday.

Employment at businesses increased by 291,000 in January after a revised 199,000 gain in the previous month, according to data from the ADP Research Institute.

The article includes the following statistics:

  • The larger-than-expected gain was broad-based and included the biggest advance in service industry payrolls since February 2016, including a record surge in hiring at leisure and hospitality companies in data back to 2002.
  • The report is in line with last week’s statement from Federal Reserve policy makers following their meeting on interest rates. The Fed said that “job gains have been solid, on average, in recent months.”
  • Economists monitor the ADP data for clues about the government’s job report. The Labor Department’s employment data due Friday is expected to show a 150,000 gain in private payrolls and an unemployment rate remaining at a 50-year-low of 3.5%.
  • The government figures will also include annual revisions. In August, the Labor Department’s preliminary benchmark projections showed the number of workers added to payrolls will probably be revised down by 501,000 in the year through March 2019. ADP’s report follows a different methodology than the government’s, and the two do not directly correlate with each other.
  • ADP report showed goods-producing payrolls rose 54,000 in January, while service-provider employment increased 237,000.
  • Hiring in construction jumped 47,000, the most in a year, and manufacturing showed a 10,000 increase in January, which was the biggest gain in 11 months.
  • Payrolls at small businesses increased by 94,000 last month, the most since July 2018; rose 128,000 at medium-sized companies and 69,000 at large firms.
  • ADP’s payroll data represent about 411,000 firms employing nearly 24 million workers in the U.S.

President Trump was mocked during the election campaign for saying he could bring back manufacturing jobs and turn the economy around. His trade agreements have done what other politicians considered impossible. I should note that people who think something is impossible don’t attempt to accomplish it. Maybe we need to elect people who are willing to attempt the impossible rather than those who simply make empty promises.

Good News For The American Economy

Breitbart posted an article today about the latest jobs numbers.

The article reports:

The U.S. private sector added 202,000 positions in December, according to an estimate from ADP and Moody’s Analytics.

This far outpaced the 150,000 new hires forecast by economists. In addition, ADP revised its November estimate dramatically higher, from 67,000 to 160,000.

Somehow when there is a Republican President, the actual numbers are generally  higher than the predictions.

The article concludes:

The report suggests that the labor market ended 2019 in a position of rising strength. The Labor Department will release its report on the jobs situation on Friday. Economists expect that to show a gain of 160,000 private and public sector jobs.

Medium sized businesses, those with between 50 and 499 employees, led the way in job growth, adding 88,000 jobs. Larger businesses added 69,000 and smaller firms added 45,000, ADP/Moody’s said.

Despite the very high number of new positions in December, Moody’s Analytics chief economist Mark Zandi said that job gains “continue to moderate.”

“Manufacturers, energy producers and small companies have been shedding jobs. Unemployment is low, but will begin to rise if job growth slows much further,” Zandi said

“As 2019 came to a close, we saw expanded payrolls in December,” said Ahu Yildirmaz, vice president and co-head of the ADP Research Institute. “The service providers posted the largest gain since April, driven mainly by professional and business services. Job creation was strong across companies of all sizes, led predominantly by midsized companies.”.

The economy continues to do well under the command of an experienced businessman. Let’s keep it that way!

The Trump Economy Is Doing Very Well

CNBC posted an article yesterday about the economy under President Trump.

The article reports:

The total number of workers hired rose to a new high in April, according to Labor Department data released Monday. But despite this, the amount of available jobs still vastly outnumbers unemployed workers.

Hirings increased to 5.9 million for the month, a gain of 240,000 from March, the Job Openings and Labor Turnover Survey (JOLTS) indicated. The hiring rate rose to 3.9%, an increase of one-tenth of a percentage point. The total hirings was the most recorded in the data series’ history going back to December 2000.

On the openings front, the gap between vacancies and available workers continued to be huge.

The article explains:

“In sum, the labor market remains strong and poised for continued solid job growth,” Ward McCarthy, chief financial U.S. economist at Jefferies, said in a note. “Despite the 21.4 [million] private sector jobs that have been generated to-date this cycle, the private business sector continues to generate a very strong demand for labor that is evidenced by the very large number of job openings that business wants to fill. The biggest threat to job growth is available supply, not demand for labor.”

Separations increased by 70,000 to 5.58 million, a rate of 3.7%, which was unchanged from March.

The JOLTS data lags other employment indicators by a month but is nonetheless watched closely by the White House and the Federal Reserve as an indicator of labor market slack. A large number of available workers compared with job openings would indicate a tight market in which wages should be rising.

The current economy has created wage increases and job opportunities for the middle class, which languished under President Obama. Unemployment among minorities is lower than it has ever been and wages are increasing for minorities. This is a success story the media is working very hard to ignore.

This Is How You Actually Help Middle-Class Families

On Friday, Investor’s Business Daily posted an editorial with the title, “Trump Delivers For Workers … After Years Of Empty Obama Promises.” The editorial cites the latest jobs report and explains how that excellent report is the result of President Trump’s economic policies. The first thing to remember here is that President Trump is a businessman–not a politician (although he has a very fast learning curve). His approach to government seems to be very similar to that of a businessman–what is the most efficient way to solve a problem? There are those in Washington who do not welcome this approach.

The editorial reminds us:

The 304,000 gain in jobs reported by the Labor Department was nearly twice the consensus estimate. And it comes after December’s expectation-busting gains.

There’s more. The jobs picture is so strong right now that it’s pulling people in who’ve been sitting on the sidelines.

In fact, for the first time in more than 20 years, the number of people who are out of the labor force — those without jobs and not looking — shrank by 647,000 over the past 12 months. So many people are returning to the labor force that the official unemployment rate is going up, even as the job market booms.

This comes, mind you, at a time when baby boomers are retiring en masse. Under Obama, in contrast, the number of labor force dropouts exploded by 14.4 million.

The latest numbers also underscore a point we’ve been making in this space for months — that all the talk of a tight labor market overlooked the vast pool of idle workers during the Obama years.

The editorial concludes:

Other evidence of this turnaround came earlier in the week, when the Labor Dept reported that private sector wages and salaries climbed 3% last year — the biggest annual increase in a decade. Under Obama, private sector wage gains averaged just 2%.

Why Now?

So why now, this late in the game?

The answer is simple. At least to those not blinded by partisanship or economic ideology.

For eight years, Obama kept promising “bottom-up growth,” while telling the country that tax cuts and deregulation would only benefit the rich. But his policies — Dodd-Frank, ObamaCare, higher taxes, a regulatory tsunami — produced economic stagnation. As it always does, that stagnation hurt the working class most.

Trump went in the opposite direction. His pro-growth tax cuts, deregulatory campaign and pro-energy policies fueled huge increases in economic optimism and turbocharged the economy. And now we’re seeing real job growth and strong wage gains for the first time in more than a decade.

You tell us which approach is proving more worker friendly.

Wouldn’t it be nice if Republicans and Democrats could work together to insure the continuation of this economic growth?

The Workforce Participation Rate

Yesterday CNS News posted an article about the January Workforce Participation Rate. This is the number of people in America either working or looking for jobs. When President Obama took office in January 2009, the Workforce Participation Rate was 65.7. That number dropped to a low of 62.4 in September 2015 and began slowly climbing, reaching a high of 62.9 in September 2016. The number hovered around there for a while until finally reaching 63.2 in January 2019.

Here is the chart from the Bureau of Labor Statistics:

The article at CNS News reports:

The Labor Department’s Bureau of Labor Statistics said the economy added 304,000 jobs last month, higher than analysts were expecting.

The number of employed Americans, 156,694,000, was slightly below last month’s record (156,945,000), and the unemployment rate increased a tenth of a point to 4.0 percent.

But the labor force participation rate increased a tenth of a point to 63.2 percent — the highest it’s been on President Trump’s watch.

The CNS News article included an excerpt from the Congressional Budget Report released this week:

According to CBO:

Employment: Nonfarm payroll employment is projected to grow by an average of 148,000 jobs per month in 2019, a decline from 213,000 jobs/month in 2018 but “still a healthy pace of job growth at this stage of the business cycle.”

Unemployment rate: The unemployment rate, now at its lowest point since the 1960s, is projected to fall from 3.8 percent in the fourth quarter of 2018 to 3.5 percent by the end of 2019. The anticipated decline in the unemployment rate reflects a continued increase in the demand for labor, which will reduce the number of unemployed workers in the labor force this year.

CBO said the demand for labor and the resulting upward pressure on compensation also encourages people to remain in the labor force or rejoin it, making the labor force larger and thus moderating the decline in the unemployment rate.

Labor force participation: The labor force participation rate, which has hovered around 62.8 percent since 2014, is expected to remain close to that rate during the next two years.

CBO explained that the stability of the labor force participation rate in recent years reflects the balancing of two opposing forces: sustained economic growth, which continues to encourage additional workers to enter the labor force and currently employed workers to stay on the job; and long-run shifts in demographics (particularly the aging of the population).

Labor compensation. After several years of prolonged weakness, wage growth accelerated notably in 2018, CBO noted. Over the next few years, labor compensation is expected to rise further as employment remains at elevated levels and firms must compete for a relatively small pool of unemployed or underemployed workers.

In CBO’s projections, annual growth of the employment cost index for wages and salaries of workers in private industry averages 3.5 percent between 2019 and 2023, slightly more rapid than its 3.3 percent pace in 2018 and considerably more rapid than the 2.0 percent average from 2009 to 2017.

President Trump’s economic policies are working. If he is allowed to continue those policies with a Democrat House of Representatives, he will be re-elected in 2020, so prepare to see the House of Representatives attempt to roll back many of those policies.

The Economy Under President Trump

Breitbart is reporting today that the Labor Department has stated that initial claims for state unemployment benefits dropped 8,000 to a seasonally adjusted 207,000 for the week ending September 29th.

The article reports on the impact of Hurricane Florence:

Hurricane Florence, which hit North Carolina and South Carolina last month, affected claims, according to the Labor Department. The largest increases in initial claims for the week ending September 22 was in North Carolina. Claims in South Caroline rose by 2,830, the third largest rise behind Kentucky.

The article concludes:

Jobless claims, which are a proxy for layoffs, have been closely watched for signs that trade disputes would be a drag on the labor market. Earlier this year, economists predicted that the steel and aluminum tariffs imposed by the Trump administration would cost 400,000 jobs. That prediction now looks way too pessimistic.

The jobless claims data has no impact on the monthly employment report, which is scheduled for release on Friday. Bloomberg’s survey of economists sees nonfarm payrolls likely increased by 18o,000 in September after rising 201,000 in August. The unemployment rate is expected to fall one-tenth of a percentage point to 3.8 percent, an 18-year low first hit in May.

President Trump may not be the perfect role model for your son, but it is obvious that he is a very savvy businessman who is working for the benefit of all Americans. I hope all Americans will vote next month to elect people who will support his policies. His economic policies are obviously working.

Something That Is Happening Underneath The Noise

The Wall Street Journal posted an article today about how the economy is doing under the Trump administration.

The article reports:

The number of Americans filing applications for new unemployment benefits fell to a new 49-year low for the third straight week, though Hurricane Florence’s effect on the jobs market remains unclear.

Initial jobless claims, a proxy for layoffs across the U.S., fell by 3,000 to a seasonally adjusted 201,000 in the week ended Sept. 15, the Labor Department said Thursday. It was the lowest level since December 1969, and less than the 210,000 claims economists surveyed by The Wall Street Journal expected.

The article includes the following chart:

The article concludes:

Jobless claims have remained low in recent years, as the labor market continues to tighten and managers face difficulty finding qualified employees. The unemployment rate has been hovering near an 18-year low in recent months.

The number of claims workers made for longer than a week declined by 55,000 to 1,645,000 in the week ended Sept. 8. The figure, also known as continuing claims, is reported with a one-week lag.

This growth is the result of deregulation, tax cuts, and the energy policy of the Trump administration. This growth will halt abruptly if the Democrats take control of Congress in November as they have already announced plans to reverse the policies put in place by the Trump administration that have resulted in the growth.

The Trump Economy Keeps Rolling Along

The Wall Street Journal posted an article today about the latest unemployment numbers. There is lots of good news.

The article reports:

The U.S. labor market was firing on all cylinders in May: the unemployment rate fell to an 18-year low, employers added jobs at a faster pace and wages modestly improved.

The unemployment rate ticked down to a seasonally adjusted 3.8%, matching April 2000 as the lowest reading since 1969, the Labor Department said Friday. Nonfarm payrolls rose a seasonally adjusted 223,000 in May, a jump from gains from March and April. Average hourly earnings ticked up to a 2.7% from a year earlier—and raises were even stronger for nonmanagers.

According to the Bureau of Labor Statistics the workforce participation rate is at 62.7. That number has fluctuated very little since January 2016. It should increase as the economy further improves.

The article further reports:

A broad measure of unemployment and underemployment that includes Americans stuck in part-time jobs or too discouraged to look for work fell to 7.6% from 7.8% the prior month. That rate, known as the U-6, remains somewhat elevated compared with the last time unemployment was similarly low. In April 2000, the broader measure was 6.9%.

Like him or hate him, Donald Trump understands what was needed to grow the American economy. I am grateful that he is helping all of us to prosper.

The article also reports:

The unemployment rate for women, 3.6% last month, was the lowest since 1953, when far smaller share of women sought jobs. The jobless rates for blacks, Latinos and those without high-school diplomas are trending near record lows.

It is amazing what has happened to the economy in the last eighteen months. I suspect that not everyone is cheering.


Leadership Matters

Bloomberg is reporting today that real disposable income, or earnings adjusted for taxes and inflation, advanced 0.6 percent from the prior month, the biggest gain since April 2015, according to a Commerce Department report Thursday. Part of that I suspect is due to the tax cuts, but there are other things that have made this possible.

The article reports:

The data, covering the first month since the tax law was signed in December, reflected a $30 billion increase in one-time bonuses and a $115.5 billion annualized drop in personal taxes, the Commerce Department said. Such boosts to Americans’ wallets, along with a tight labor market, will sustain spending. Those items, plus rising prices, are likely to keep Fed policy makers on track for at least three interest-rate increases this year, including one that’s widely expected later in March.

 A separate Labor Department report on Thursday showed weekly filings for unemployment benefits fell to the lowest level since 1969.

 The reduction in taxes helped boost the saving rate to 3.2 percent, the highest since August, from 2.5 percent in December, which was the lowest since 2007.

Most Americans pay a higher percentage of their income in taxes than what Medieval serfs paid the lord of the manor to farm their land.

The article concludes:

The Fed’s preferred price gauge — tied to consumption — rose 0.4 percent in January from the previous month and was up 1.7 percent from a year earlier. Inflation has mostly missed the central bank’s 2 percent target since 2012, though policy makers expect it to rise toward the goal.

Excluding food and energy, so-called core prices rose 0.3 percent, matching the median estimate. The core index, which Fed officials see as a better indicator of underlying price pressures, was up 1.5 percent from January 2017, the same annual gain as the prior three months.

Adjusted for inflation, personal spending declined 0.1 percent in January from the prior month, the first decrease in a year. The weakness reflected a 1.6 percent slump in outlays for durable goods as auto sales cooled.

There are a number of reasons for the improvement of the economy–ending regulations that made it very difficult to start or run a business, putting more money in Americans’ pockets by lowering the individual tax burden, ending the financial penalties that were included in ObamaCare, lowering corporate tax rates to make American more competitive worldwide as a place to locate a business, and simply making it clear that America now welcomes businesses and is prepared to encourage entrepreneurship. Even if you don’t support President Trump, you need to acknowledge that he has been a successful businessman who is attempting to bring that success to America as a whole.

Lied To (Again)

Yesterday The New York Post posted an article about the Labor Department‘s December jobs report. I am probably not the only one who wondered why the jobs added number was lower than expected (I see signs of economic recovery all around me–new shops, new construction, formerly unemployed people going back to work, people getting bonuses, etc.). Well, it seems that there was more to the numbers than I thought.

The article reports:

But the number was kept artificially low by a seasonal adjustment that wasn’t comparable to the one done a year earlier, in December 2016.

And it’s unusual for one December’s adjustment to be so different from the previous December.

If the adjustments had been consistent, last Friday’s number would have shown growth of another 133,000. Add the growth that was announced (148,000 jobs) and the seasonal adjustment difference (133,000) and this December’s growth would have been a very, very healthy 281,000 jobs.

How to lie with statistics.

It gets worse:

There was another adjustment that made Friday’s job number look worse than it would have been.

In the December figure released last Friday, the government deducted 38,000 jobs that it thinks were lost but can’t prove were lost because they happened inside very small companies.

A year earlier, in December 2016, only 17,000 jobs were deducted for this reason.

Again, if Labor has simply remained consistent, December’s jobs gains could have been as high as 300,000.

As I’ve explained many times before, the government’s economic statistics are not expected to be completely accurate the first time they are announced — even though Wall Street and the media treat them like they are.

That’s why the government does numerous revisions.

I guess the only numbers we can actually believe are the ones in the final revision!

The Economy Is Still Limping Along

Bloomberg News posted an article today about last week’s jobless numbers.

The article includes the following chart:

May12JoblessClaims

The article reports:

A jump in filings in New York state may reflect striking workers at Verizon Communications Inc., spring break holiday at schools or a combination of the two. Economists will continue to monitor claims data in the coming weeks before concluding that the labor market is taking a bigger step back.

 “New York accounted for most of the increase,” said Jacob Oubina, a senior U.S. economist at RBC Capital Markets LLC in New York. “It’s not a clean read.”

Color me skeptical.

The article further reports:

A report last week showed that U.S. employers added 160,000 workers to their payrolls in April, the fewest since September and well below economists’ median forecast.

Another report from the Labor Department showed import prices rose 0.3 percent for a second month in April, largely reflecting a pickup in petroleum and food. While industrial supply costs increased, prices declined for consumer and capital goods made overseas.

I think we need a serious change in economic policies.


The Unemployment Numbers Are Lying And This Is How We Got Here

On September 5, the Weekly Market Wrap at NASDAQ listed the unemployment rate at 6.1 percent.

The article also reported:

In economic news, in the week ending August 30, the advance figure for seasonally adjusted initial claims (unemployment benefits) was 302,000, an increase of 4,000 from the previous week’s unrevised level of 298,000. The 4-week moving average was 302,750, an increase of 3,000 from the previous week’s unrevised average of 299,750.

So we have an increase of unemployment claims, but an unemployment rate holding steady at 6.1 percent. How does the government do that? Easy–shrink the labor force so the percentage stays the same.

Today’s Washington Examiner reports:

It came as quite a disappointment last Friday when the Labor Department announced that the U.S. economy created only 142,000 net jobs in August. Even worse, this anemic number came with a downward revision of a combined net 28,000 jobs for the previous two months.

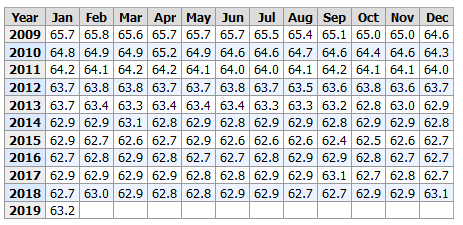
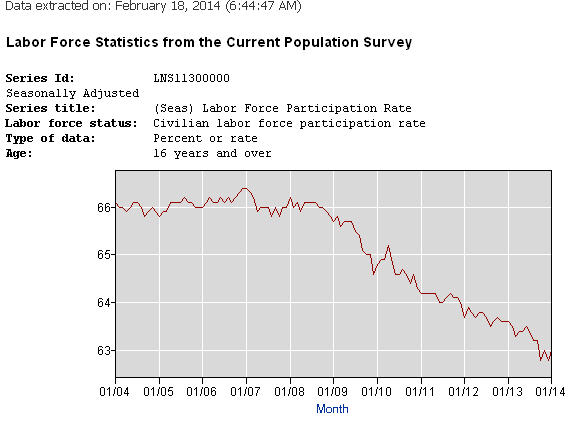
Now add to these a third unwelcome piece of news: The U.S. labor force participation rate — that is, the share of working-age Americans who are either working or seeking work — has returned to a multi-decade low of 62.8 percent, down from 65.9 percent before the recession. This number, which has been in a nosedive ever since the 2008 recession began, remains mired at levels that haven’t been seen since women began entering the workforce in large numbers. Fewer Americans are in the labor market today than at any point since 1978.

President Obama is not responsible for what happened before he took office, but his policies have resulted in the failure of the economy to rebound from the 2008 recession.

I apologize for the length of what is to follow, but every now and then I think it is a good idea to remember how we got here.

The recession is not President Obama’s fault; it is not President Bush’s fault; it is not the result of greedy bankers, capitalism, or Wall Street. It is the result of faulty government regulation. The recession was the result of the housing bubble–it’s roots go back to the 1977, when President Jimmy Carter signed into law the Community Reinvestment Act (CRA) passed by Congress. Congress had good intentions–the law was passed to help low-income families buy houses. The idea was to reduce discrimination in housing loans. In 1995 President Clinton modified the law–the idea was to make the paperwork easier to navigate and to make the CRA ratings of banks available to the public. The securitization of CRA loans (including subprime mortgages) began in 1997.  In 1999 Senators Chris Dodd and Charles Schumer worked on legislation that allowed the Federal Deposit Insurance Act  to allow banks to merge or expand into other types of financial institutions. Under pressure from political action groups, banks began issuing more subprime loans–selling them in groups in investment packages along with loans that had a better chance of being paid back.

In October 2000, Fannie Mae announced a pilot plan to purchase $2 billion of “MyCommunityMortgage” loans. The pilot lenders agreed to customize affordable products for low and moderate-income borrowers. There is nothing wrong with the intention here, but it is not a good idea to lend money unless you have a reasonable expectation of getting it back. The increase in loans caused the price of housing to rise faster than the rate of inflation (which is traditionally the rate of the rise of housing costs). Companies began offering ‘interest only’ and ‘variable interest’ loans so that people could make lower payments on larger houses while the value of their houses increased.  Banks were forced to issued subprime mortgages or pay large penalties to the government. Fannie Mae prospered because it made more loans and sold them. It’s executives raked in amazing amounts of money. The companies writing the subprime mortgages wrote sweetheart mortgage loans to their friends in Congress. In 2004, 92 percent of the loans issued by Fannie Mae were variable-interest- rate loans; in 2005, 91 percent were variable-interest-rate loans. Fannie Mae guaranteed the mortgages they granted and sold them to banks and investors. Home ownership and home prices continued to rise. Then, in 2004, interest rates began to rise, and gasoline prices climbed. In 2007 the subprime mortgage market collapsed because low-income families could not pay their mortgages. Foreclosures increased. There were no buyers. Home prices began to drop. By September of 2008, twelve banks had failed during that year because of worthless government securities issued by Fannie Mae.

So did anyone try to stop this runaway train? Yes. In 2003, President Bush proposed legislation to overhaul the housing finance industry. The President wanted to create a new agency within the Treasury Department to oversee Fannie Mae and Freddie Mac. The Democrats in Congress blocked the legislation, saying it might interfere with the ability of low-income families to buy homes. Barney Frank, a Democrat from Massachusetts, stated, “The more people exaggerate these problems, the more pressure there is on these companies, the less we will see in terms of affordable housing.” Melvin Watt, a Democrat from North Carolina, stated, “…and in the process weakening the bargaining power of poorer families and their ability to get affordable housing.” In 2005, John McCain, a Republican from Arizona, warned of an upcoming mortgage collapse. He sponsored the Housing Enterprise Regulatory Act of 2005 (www.govtrack.us Bill S-190). The purpose of the bill was to regulate Fannie Mae and Freddie Mac. Democrats blocked the bill. The bill was reintroduced in 2007. Again, it was blocked by members of the Senate who had received benefits from the companies involved in the subprime scandal. Senator Chris Dodd, a Democrat from Connecticut, had received a sweetheart loan from one of the companies. Jim Johnson, a key member of the Obama campaign team, also received a sweetheart loan from Countrywide Mortgage. From 1991 through 1998, Jim Johnson was the CEO of Fannie Mae. Johnson received $21 million during his tenure there.

The original intent of the CRA was good. It is a wonderful idea to give everyone an opportunity to buy a home. Unfortunately, the expansion of the CRA had the exact opposite effect. Because the government interfered in the free market, a bubble was created. Expectations of what a house should be changed during that time. In the 1960’s and 1970’s there was the concept of a ‘starter home.’ A starter home was usually a relatively inexpensive small house that was affordable, and the equity gained while living there could be used to buy a larger house after a couple started a family. That concept is gone. Look around. What are people building in your neighborhood? The housing bubble reflected a change in what Americans expect in housing. We have lost our moorings for the sake of conspicuous consumption. There is nothing wrong with owning a large home, but we need to balance our wishes with our income; otherwise, America will drown in personal debt as well as federal debt.

About Those Unemployment Numbers

John Crudele at the New York Post has done a number of stories about fraud in the reporting of the unemployment numbers. He posted a story yesterday about the Congressional investigations into this fraud, including an investigation by the House Oversight Committee and Congress’ Joint Economic Committee. He adds that he is also investigating. He is currently waiting for the Commerce Department to comply with a Freedom of Information Act request he has filed for e-mails and text messages between people in the Philadelphia Census office.

The article reports:

At the core of all these investigations is solid evidence that at least one surveyor — a guy named Julius Buckmon, working out of the Philadelphia Census office but polling in Washington, DC — submitted fake household surveys that were used in compiling the Labor Department’s unemployment rate.

Because of the scientific nature of the Labor Department survey, Buckmon’s actions alone would have affected the responses of some 500,000 households.

But as I’ve been reporting, the scam was allegedly much larger than that and included other surveyors (or enumerators as they are called) over many years. And supervisors at least two levels up are said to have known about — and covered up — the scandal.

What the investigators are looking for is that the unemployment numbers were falsified so that they would drop just before the 2012 election. In fact, the unemployment rate did drop before the election.

This is a chart from trading economics.com:

United States Unemployment Rate

Before you get too excited over the fact that unemployment may be dropping, you need to take a look at the labor force participation rate. When people stop looking for jobs, they are no longer counted as unemployed. Therefore, as the number of people who are working drops, the unemployment rate drops. That is not the way it should be, but it is the way it is. The chart below from the Bureau of Labor Statistics shows what has happened to our labor force participation rate since 2009:

laborparticipationrate2014Regardless of whether or not there is fraud involved, our current unemployment numbers are very misleading. Please follow the link above to the New York Post to hear the rest of the story. There is a smoking gun. Unfortunately, the person in charge at the time is claiming that he never saw it.

Enhanced by Zemanta

Economic Recovery????

Fox Business reported today that the weekly jobless claims jumped to 368,000 this week.

The article reports:

Initial claims for state unemployment benefits surged 68,000 to a seasonally adjusted 368,000, the Labor Department said on Thursday. That was the largest weekly increase since November 2012. Claims for the prior week were revised to show 2,000 more applications received than previously reported.

No explanation has been given for the jump. The claims report also showed an increase in the number of people collecting benefits. The number jumped 40,000 to 2.79 million in the week ended Nov. 30.

On Sunday I posted an article (rightwinggranny.com) questioning the accuracy of the unemployment numbers we are being given. It is interesting to compare the actual numbers with the numbers being given out during the previous week.

Enhanced by Zemanta

About Those Jobs Numbers

John Crudele at the New York Post has posted a few articles raising questions about how the Obama Administration is calculating unemployment numbers. He posted one yesterday. Mr. Crudele has pointed out that unemployment numbers are coming from the Census Bureau and that in 2010 one of its enumerators was caught fabricating interviews.

The article reports:

The Census Department surveys that went into the November jobless rate actually took place during the week that included Nov. 5 instead of the normal Nov. 12 week.

The Labor Department did put in a note about the survey week change in its November report.

But it should also have included another line that said: “The data for the unemployment rate may have been compromised. Lots of people are looking into the matter right now. We’ll get back to you on whether you should believe these numbers or not.”

John Hinderaker posted a story about the jobs numbers at Power Line today.

The article at Power Line includes the following chart:

120613-600x375

The chart shows what has happened to the labor participation rate since 2008–it dropped like a rock and stayed there.

The article at Power Line quotes James Pethokoukis of the American Enterprise Institute:

    1. There are still 1.1 million fewer employed Americans today than right before the recession started, despite a potential labor force that’s 14 million larger. And there are 3.6 million fewer full-time workers than back in 2007.

    2. The employment rate, the share of Americans with a job, is 58.6% — exactly where it was in November 2009.

    3. If the labor force participation rate were where it was a year ago, the jobless rate would be 7.9%, not 7% (and 11.3% if the LFPR were at prerecession levels, though closer to 9% if demographics-adjusted).

The article at Power Line concludes:

Back in the heady days of 2008 and 2009, the Democrats were universally confident that the economy would improve dramatically, as it always does after a recession, regardless of the policies the Democrats followed. All they would need to do was take credit when the time came. The bitter lesson of the last five years is that federal policies do matter. The American economy is diverse and resilient, but if our government’s policies are stupid enough, they can blight the prospects of an entire generation.

If you were planning to break out the champagne because of the 7 per cent unemployment rate, you might want to hold off for a little bit. If you want to turn this around, think before you vote.


Enhanced by Zemanta

Changing The Numbers To Fit The Situation

Remember when 5 percent unemployment under George W. Bush meant that we were in horrible economic straits? Remember when gas prices hit $3.00 a gallon under George W. Bush and it was the end of the American economy as we knew it? Anyone else long for those days?

We are being told that the unemployment rate is currently hovering around 7 percent. We are also watching the labor participation rate fall to 62.8 percent (Investor’s Business Daily). This puts the true unemployment rate at about 11.8 percent.

Investor’s Business Daily reports:

When the economy fell into recession in December 2007, the jobless rate was 5% and the labor force participation rate was 66%. As job losses surged, unemployment doubled to 10% in October 2009, a few months after the recession officially ended. The jobless rate slowly began to edge down, but held at 9% or above for nearly two years, and above 8% for nearly three years.

But the drop largely reflected job market weakness rather than strength. During this time, labor force participation steadily fell. In October 2009, when official unemployment peaked, participation was 65%. A year later it was 64.4%. Now, more than four years into the expansion, it’s 62.8%, the lowest in 35 years.

But wait–there’s more. The New York Post reported yesterday that Congress will begin an investigation on how unemployment numbers have been calculated and released particularly during the run-up to the 2012 election.

The article at the New York Post reports:

Last week I reported exclusively that someone at the Census Bureau’s Philadelphia region had been screwing around with employment data. And that person, after he was caught in 2010, claimed he was told to do so by a supervisor two levels up the chain of command.

On top of that, a reliable source whom I haven’t identified said the falsification of employment data by Census was widespread and ongoing, especially around the time of the 2012 election.

In 2009, before the 2010 census was taken, the White House changed the rules on how the census would be reported. The Census Bureau would report to senior White House aides. I will admit that at the time I thought this would result in some population statistics being altered to increase the number of votes in blue states and decrease the number of votes in red states. It didn’t occur to me at the time that these numbers could also be used to skew unemployment data.

The New York Post continues:

Back in 2010, I started getting reports that the Census Bureau had some very unusual hiring practices. Census takers and supervisors — at risk of heavy fines — were reporting to me that large numbers of people were being hired only to be fired shortly afterward. And then rehired.

I theorized at the time that Census was trying to make the job-creation totals look better nationwide in those bleak months leading up to the midterm congressional elections.

This employment policy seemed too coordinated. The regional higher-ups at Census couldn’t be doing this on their own; there had to be a grander plan.

I still don’t know what was going on.

But then I heard about the falsification in Philly. This time, however, it wasn’t the employment numbers that were being doodled with. This time it was the unemployment data, which are gathered at the Census Bureau and handed over raw to the Labor Department.

Please follow the link and read the entire story. Unfortunately most of the media is unaware of this or ignoring it. As voters, all of us need to be aware of what is taking place here.

Enhanced by Zemanta